Belfast Dock (Northern Ireland Parliament constituency)
54°36′47″N 5°55′44″W / 54.613°N 5.929°W
| Belfast Dock | |
|---|---|
| Former Borough constituency for the Parliament of Northern Ireland | |
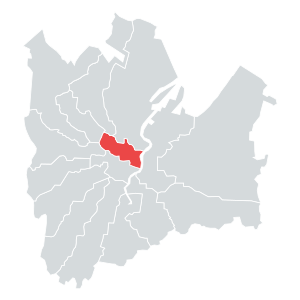
 Belfast Dock shown within Belfast and Belfast shown within Northern Ireland | |
| Former constituency | |
| Created | 1929 |
| Abolished | 1973 |
| Election method | First past the post |
Belfast Dock was a constituency of the Parliament of Northern Ireland.
Boundaries
[edit]Belfast Dock was a borough constituency comprising part of northern Belfast. It was created in 1929 when the House of Commons (Method of Voting and Redistribution of Seats) Act (Northern Ireland) 1929 introduced first-past-the-post elections throughout Northern Ireland.
Belfast Dock was created by the division of Belfast East into four new constituencies. It survived unchanged, returning one member of Parliament, until the Parliament of Northern Ireland was temporarily suspended in 1972, and then formally abolished in 1973.[1]
The boundaries were the same as the former Dock ward. This meant that the boundary ran from Carlisle Circus, along Clifton Street, up North Queen Street, along Great George's Street, along the Belfast Lough, along Brougham Street and Duncairn Gardens and from the top of Duncairn Gardens, along the Antrim Road to Carlisle Circus. Consequently, the constituency was almost identical to the current New Lodge ward.
The constituency is now part of Belfast North.
Politics
[edit]The constituency was one of the most marginal in the Northern Ireland Parliament changing hands at every election until 1965. In every election from 1933 to 1965 the incumbent member lost his seat.[1]
Members of Parliament
[edit]Elections results
[edit]| (1921–72) |
 |
|---|
| Party | Candidate | Votes | % | ±% | |
|---|---|---|---|---|---|
| UUP | Charles Blakiston-Houston | 4,035 | 46.6 | ||
| NI Labour | Dawson Gordon | 3,003 | 34.7 | ||
| Ind. Unionist | James Woods Gyle | 1,619 | 18.7 | ||
| Majority | 1,032 | 11.9 | |||
| Turnout | 8,657 | 73.7 | |||
| UUP win (new seat) | |||||
| Party | Candidate | Votes | % | ±% | |
|---|---|---|---|---|---|
| NI Labour | Harry Midgley | 4,893 | 57.0 | +22.3 | |
| UUP | Charles Blakiston-Houston | 3,685 | 43.0 | −3.6 | |
| Majority | 1,208 | 14.0 | N/A | ||
| Turnout | 8,578 | 77.5 | +3.8 | ||
| NI Labour gain from UUP | Swing | ||||
| Party | Candidate | Votes | % | ±% | |
|---|---|---|---|---|---|
| UUP | George Anthony Clark | 3,578 | 42.6 | −0.4 | |
| Nationalist | James Collins | 2,891 | 34.5 | New | |
| NI Labour | Harry Midgley | 1,943 | 22.9 | −34.1 | |
| Majority | 687 | 8.1 | N/A | ||
| Turnout | 8,412 | 82.5 | +5.0 | ||
| UUP gain from NI Labour | Swing | ||||
| Party | Candidate | Votes | % | ±% | |
|---|---|---|---|---|---|
| NI Labour | Hugh Downey | 3,985 | 57.7 | +34.8 | |
| UUP | George Anthony Clark | 2,924 | 42.3 | −0.3 | |
| Majority | 1,061 | 15.4 | N/A | ||
| Turnout | 6,909 | 78.5 | −4.0 | ||
| NI Labour gain from UUP | Swing | ||||
| Party | Candidate | Votes | % | ±% | |
|---|---|---|---|---|---|
| UUP | Thomas Loftus Cole | 3,674 | 52.0 | +9.7 | |
| NI Labour | Hugh Downey | 3,390 | 48.0 | −9.7 | |
| Majority | 284 | 4.0 | N/A | ||
| Turnout | 7,064 | 79.8 | +1.3 | ||
| UUP gain from NI Labour | Swing | ||||
| Party | Candidate | Votes | % | ±% | |
|---|---|---|---|---|---|
| Irish Labour | Murtagh Morgan | 3,537 | 51.3 | New | |
| UUP | Thomas Loftus Cole | 3,358 | 48.7 | −3.3 | |
| Majority | 179 | 2.6 | N/A | ||
| Turnout | 6,895 | 75.9 | −3.9 | ||
| Irish Labour gain from UUP | Swing | ||||
| Party | Candidate | Votes | % | ±% | |
|---|---|---|---|---|---|
| UUP | William Oliver | 3,156 | 52.1 | +3.4 | |
| Irish Labour | Gerry Fitt | 2,900 | 47.9 | −3.4 | |
| Majority | 256 | 4.2 | N/A | ||
| Turnout | 6,056 | 73.9 | −2.0 | ||
| UUP gain from Irish Labour | Swing | ||||
| Party | Candidate | Votes | % | ±% | |
|---|---|---|---|---|---|
| Irish Labour | Gerry Fitt | 3,288 | 54.2 | +6.3 | |
| UUP | William Oliver | 2,781 | 45.8 | −6.3 | |
| Majority | 507 | 8.4 | N/A | ||
| Turnout | 6,069 | 77.9 | +4.0 | ||
| Irish Labour gain from UUP | Swing | ||||
| Party | Candidate | Votes | % | ±% | |
|---|---|---|---|---|---|
| Republican Labour | Gerry Fitt | 3,326 | 62.3 | +8.1 | |
| UUP | William Oliver | 2,016 | 37.7 | −8.1 | |
| Majority | 1,310 | 24.6 | N/A | ||
| Turnout | 5,342 | 70.3 | −7.6 | ||
| Republican Labour gain from Irish Labour | Swing | ||||
| Party | Candidate | Votes | % | ±% | |
|---|---|---|---|---|---|
| Republican Labour | Gerry Fitt | 3,274 | 62.8 | +0.5 | |
| UUP | Harold E. Smith | 1,936 | 37.2 | −0.5 | |
| Majority | 1,338 | 25.6 | +1.0 | ||
| Turnout | 5,210 | 72.2 | +1.9 | ||
| Republican Labour hold | Swing | ||||
