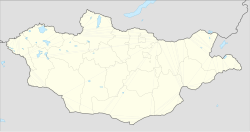
Baruunturuun
Baruunturuun District
Баруунтуруун сум ᠪᠠᠷᠠᠭᠤᠨᠲᠤᠷᠤᠭᠤᠨᠰᠤᠮᠤ | |
|---|---|
| Coordinates: 49°39′30″N 94°23′57″E / 49.65833°N 94.39917°E | |
| Country | Mongolia |
| Elevation | 1,232 m (4,045 ft) |
| Population (2008) | |
• Total | 2,810 |
| Time zone | UTC+7 |
Baruunturuun (Mongolian: Баруунтуруун) is a sum in Uvs Province of Mongolia.
It is the heartland of grain production in the province,[citation needed] and lies on the bank of the Turuun River. The sum is also one of the most populous areas in the province. MIAT Mongolian Airlines flew to Baruunturuun directly from Ulaanbaatar until 2005, but stopped due to a plane shortage. Although the Baruunturuun Airport is not operational at the moment, it is considered the secondary airport of the province.[citation needed]
Climate
[edit]Baruunturuun has a continental climate (Köppen climate classification Dwb) closely bordering on a subarctic climate (Köppen climate classification Dwc) with mild to warm summers and bitterly cold winters even for Mongolia, owing to very strong altitudinal temperature inversions from drainage of cold air into the western valleys.[2]
Baruunturuun experiences 209.9 days per year with minimum temperature below the freezing point and 151 days in which the maximum temperature is below such threshold.[3] The average minimum temperature in January is −36.3 °C (−33.3 °F), and the lowest recorded temperature was −49.9 °C (−57.8 °F). Temperatures in summer can be hot; in 10.9 days per year the daily maximum temperature is at or above 30.0 °C (86.0 °F).[3] The highest temperature recorded is 39.2 °C (102.6 °F). Much precipitation falls in the summer as rain, with some snow in the spring and autumn. Winters are quite dry, with only light snowfall. The average wind speed does not exceed 1 metre per second (3.6 km/h) in winter.[3]
| Climate data for Baruunturuun (1991-2020, extremes 1961-2020) | |||||||||||||
|---|---|---|---|---|---|---|---|---|---|---|---|---|---|
| Month | Jan | Feb | Mar | Apr | May | Jun | Jul | Aug | Sep | Oct | Nov | Dec | Year |
| Record high °C (°F) | 4.9 (40.8) |
4.9 (40.8) |
17.6 (63.7) |
28.4 (83.1) |
31.5 (88.7) |
35.7 (96.3) |
39.2 (102.6) |
35.8 (96.4) |
33.5 (92.3) |
23.9 (75.0) |
13.5 (56.3) |
13.0 (55.4) |
39.2 (102.6) |
| Mean daily maximum °C (°F) | −24.7 (−12.5) |
−21.8 (−7.2) |
−10.4 (13.3) |
5.1 (41.2) |
17.6 (63.7) |
23.0 (73.4) |
23.7 (74.7) |
22.3 (72.1) |
16.6 (61.9) |
6.1 (43.0) |
−7.5 (18.5) |
−20.8 (−5.4) |
2.4 (36.4) |
| Daily mean °C (°F) | −31.4 (−24.5) |
−28.3 (−18.9) |
−18.4 (−1.1) |
−1.6 (29.1) |
10.1 (50.2) |
15.9 (60.6) |
17.1 (62.8) |
15.3 (59.5) |
8.9 (48.0) |
−0.7 (30.7) |
−14.3 (6.3) |
−26.6 (−15.9) |
−4.5 (23.9) |
| Mean daily minimum °C (°F) | −36.3 (−33.3) |
−35.0 (−31.0) |
−24.7 (−12.5) |
−7.5 (18.5) |
2.6 (36.7) |
8.2 (46.8) |
10.9 (51.6) |
8.8 (47.8) |
2.7 (36.9) |
−6.3 (20.7) |
−19.9 (−3.8) |
−31.5 (−24.7) |
−10.7 (12.8) |
| Record low °C (°F) | −49.9 (−57.8) |
−45.9 (−50.6) |
−40.6 (−41.1) |
−30.2 (−22.4) |
−12.2 (10.0) |
−8.6 (16.5) |
0.0 (32.0) |
−4.8 (23.4) |
−12.0 (10.4) |
−25.8 (−14.4) |
−37.9 (−36.2) |
−47.1 (−52.8) |
−49.9 (−57.8) |
| Average precipitation mm (inches) | 3.8 (0.15) |
4.2 (0.17) |
7.0 (0.28) |
13.9 (0.55) |
22.5 (0.89) |
32.6 (1.28) |
58.0 (2.28) |
45.7 (1.80) |
25.3 (1.00) |
13.7 (0.54) |
12.6 (0.50) |
6.7 (0.26) |
246 (9.7) |
| Average precipitation days (≥ 1.0 mm) | 2 | 2.1 | 2.5 | 3.6 | 4.2 | 5.7 | 7.8 | 6.5 | 4.3 | 3.2 | 3.6 | 2.7 | 48.2 |
| Average relative humidity (%) | 76 | 75.8 | 78.6 | 60.8 | 47.8 | 51 | 56.6 | 58.4 | 56.8 | 62.7 | 78.2 | 79.5 | 65.2 |
| Average dew point °C (°F) | −33.5 (−28.3) |
−30.0 (−22.0) |
−18.8 (−1.8) |
−6.0 (21.2) |
−1.2 (29.8) |
5.5 (41.9) |
9.2 (48.6) |
7.5 (45.5) |
0.8 (33.4) |
−6.1 (21.0) |
−14.8 (5.4) |
−27.0 (−16.6) |
−9.5 (14.8) |
| Source: NOAA [3](temperature averages 1961-1990) [4] | |||||||||||||
References
[edit]- ^ "Baruunturuun, Mongolia". Falling Rain Global Gazetteer. Retrieved 27 January 2013.
- ^ Bayasgalan Gerelchuluun and Ahn Joong-Bae; ‘Air temperature distribution over Mongolia using dynamical downscaling and statistical correction’, International Journal of Climatology; 34:2464-2476 (2014)
- ^ a b c d "Baruuhturuun Climate Normals 1991-2020" (CSV). National Oceanic and Atmospheric Administration. Retrieved 5 May 2024.
- ^ "Baruuhturuun Climate Normals 1961-1990". National Oceanic and Atmospheric Administration. Retrieved January 12, 2012.


