2000 Plymouth City Council election
Appearance
| ||||||||||||||||||||||||||||
All 60 seats in the Plymouth City Council 31 seats needed for a majority | ||||||||||||||||||||||||||||
|---|---|---|---|---|---|---|---|---|---|---|---|---|---|---|---|---|---|---|---|---|---|---|---|---|---|---|---|---|
| ||||||||||||||||||||||||||||
 Map showing the results of the 2000 Plymouth City Council elections. | ||||||||||||||||||||||||||||
| ||||||||||||||||||||||||||||
The 2000 Plymouth City Council election was held on 4 May 2000 to elect members of Plymouth City Council in England. This was on the same day as the other local elections. The entire council was up for election and the Conservative Party gained control of the council from the Labour Party.[2]
Overall results
[edit]| Party | Seats | Gains | Losses | Net gain/loss | Seats % | Votes % | Votes | +/− | |
|---|---|---|---|---|---|---|---|---|---|
| Conservative | 38 | 26 | 0 | 65.0 | 48.1 | 29,644 | |||
| Labour | 22 | 0 | 26 | 35.0 | 35.9 | 22,115 | |||
| Liberal Democrats | 0 | 0 | 0 | 0.0 | 14.6 | 8,992 | |||
| Independent | 0 | 0 | 0 | 0.0 | 0.2 | 128 | |||
| Green | 0 | 0 | 0 | 0.0 | 0.5 | 308 | |||
| Liberal | 0 | 0 | 0 | 0.0 | 0.5 | 313 | New | ||
| Independent Democrat | 0 | 0 | 0 | 0.0 | 0.2 | 143 | |||
| Total | 60 | 61,643 | |||||||
Ward results
[edit]Budshead (3 seats)
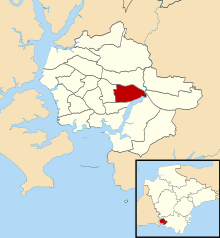
[edit]
| Party | Candidate | Votes | % | |
|---|---|---|---|---|
| Labour | Ronald Simmonds | 1,134 | ||
| Labour | Paul Carter | 1,105 | ||
| Labour | Thomas Coleman | 1,079 | ||
| Conservative | N. Milne | 708 | ||
| Conservative | J. White | 678 | ||
| Conservative | E. Wright | 645 | ||
| Liberal Democrats | S. Simmonds | 357 | ||
| Turnout | 24.7% | |||
| Labour hold | ||||
| Labour hold | ||||
| Labour hold | ||||
Compton (3 seats)
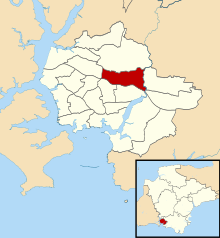
[edit]
| Party | Candidate | Votes | % | |
|---|---|---|---|---|
| Conservative | Albert Fry | 1,910 | ||
| Conservative | David Stark | 1,887 | ||
| Conservative | Thomas Savery | 1,886 | ||
| Labour | M. Dax | 646 | ||
| Labour | S. Orgill | 634 | ||
| Labour | K. French | 586 | ||
| Liberal Democrats | C. Richardson | 466 | ||
| Liberal Democrats | R. Casley | 442 | ||
| Liberal Democrats | M. Barriball | 439 | ||
| Turnout | 35.5% | |||
| Conservative hold | ||||
| Conservative hold | ||||
| Conservative hold | ||||
Drake (3 seats)
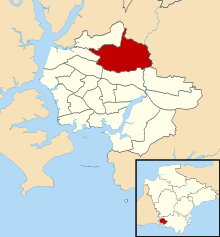
[edit]
| Party | Candidate | Votes | % | |
|---|---|---|---|---|
| Conservative | Karen Gillard | 1,190 | ||
| Conservative | Colin Miles | 1,151 | ||
| Conservative | Patrick Marshall | 1,123 | ||
| Liberal Democrats | R. Bray | 1,049 | ||
| Liberal Democrats | S. Luscombe | 989 | ||
| Liberal Democrats | R. Egerton | 974 | ||
| Labour | V. Hiromeris | 939 | ||
| Labour | C. Childs | 907 | ||
| Labour | G. Pettet | 903 | ||
| Turnout | 29.5% | |||
| Conservative gain from Labour | ||||
| Conservative gain from Labour | ||||
| Conservative gain from Labour | ||||
Efford (3 seats)
[edit]
| Party | Candidate | Votes | % | |
|---|---|---|---|---|
| Conservative | Michael Leaves | 1,353 | ||
| Labour | Bernard Miller | 1,313 | ||
| Conservative | Mary Orchard | 1,310 | ||
| Labour | Jane Margaret Jones | 1,301 | ||
| Labour | Brian Vincent | 1,278 | ||
| Conservative | P. Rickard | 1,192 | ||
| Liberal | R. Vosper | 326 | ||
| Liberal Democrats | C. Curry | 313 | ||
| Turnout | 33.1% | |||
| Conservative gain from Labour | ||||
| Labour hold | ||||
| Conservative gain from Labour | ||||
Eggbuckland (3 seats)
[edit]
| Party | Candidate | Votes | % | |
|---|---|---|---|---|
| Conservative | Gloria Bragg | 1,894 | ||
| Conservative | Michael Foster | 1,845 | ||
| Conservative | Paul Rowe | 1,788 | ||
| Labour | Derick Brian Bray | 1,605 | ||
| Labour | Michael George Wright | 1,522 | ||
| Labour | M. Robinson | 1,462 | ||
| Liberal Democrats | R. Bellamy | 496 | ||
| Turnout | 36.5% | |||
| Conservative gain from Labour | ||||
| Conservative gain from Labour | ||||
| Conservative gain from Labour | ||||
Estover (3 seats)
[edit]
| Party | Candidate | Votes | % | |
|---|---|---|---|---|
| Conservative | Peter Brookshaw | 2,419 | ||
| Conservative | Heather Ellis | 2,395 | ||
| Conservative | Alexandra Sloggett | 2,254 | ||
| Labour | L. Fone | 1,322 | ||
| Labour | Michael Robert Fox | 1,294 | ||
| Labour | P. Harvey | 1,164 | ||
| Liberal Democrats | S. Hutty | 500 | ||
| Turnout | 33.4% | |||
| Conservative gain from Labour | ||||
| Conservative gain from Labour | ||||
| Conservative gain from Labour | ||||
Ham (3 seats)
[edit]
| Party | Candidate | Votes | % | |
|---|---|---|---|---|
| Labour | Tudor Evans | 1,150 | ||
| Labour | Ian Gordon | 1,066 | ||
| Labour | Christopher Pattison | 1,034 | ||
| Conservative | D. Corry | 738 | ||
| Conservative | R. McSweeney | 698 | ||
| Conservative | M. White | 638 | ||
| Liberal Democrats | M. Luscombe | 268 | ||
| Independent Democrat | P. Stanner | 143 | ||
| Turnout | 27.5% | |||
| Labour hold | ||||
| Labour hold | ||||
| Labour hold | ||||
Honicknowle (3 seats)
[edit]
| Party | Candidate | Votes | % | |
|---|---|---|---|---|
| Labour | Alan Ford | 1,306 | ||
| Labour | Pauline Purnell | 1,206 | ||
| Labour | Peter Smith | 1,174 | ||
| Conservative | K. Foster | 915 | ||
| Conservative | J. Wallace | 894 | ||
| Conservative | R. Mahony | 881 | ||
| Liberal Democrats | M. Bellamy | 389 | ||
| Turnout | 27.0% | |||
| Labour hold | ||||
| Labour hold | ||||
| Labour hold | ||||
Keyham (3 seats)
[edit]
| Party | Candidate | Votes | % | |
|---|---|---|---|---|
| Labour | Howard Davey | 1,000 | ||
| Labour | Steven Lemin | 981 | ||
| Conservative | James Bell | 915 | ||
| Labour | A. Stephens | 904 | ||
| Conservative | D. Hooper | 903 | ||
| Conservative | J. Ellis | 812 | ||
| Liberal Democrats | M. Gallagher | 335 | ||
| Turnout | 26.7% | |||
| Labour hold | ||||
| Labour hold | ||||
| Conservative gain from Labour | ||||
Mount Gould (3 seats)
[edit]
| Party | Candidate | Votes | % | |
|---|---|---|---|---|
| Conservative | Glenn Jordan | 867 | ||
| Conservative | S. Bennett | 836 | ||
| Labour | A. Hughes | 808 | ||
| Conservative | J. Pritchard | 805 | ||
| Labour | John Gerard Williams | 793 | ||
| Labour | Edwin Shaun Rennie | 754 | ||
| Liberal Democrats | A. Egerton | 482 | ||
| Liberal Democrats | G. Nye | 456 | ||
| Liberal Democrats | P. York | 449 | ||
| Independent | C. Brown | 128 | ||
| Turnout | 28.0% | |||
| Conservative gain from Labour | ||||
| Conservative gain from Labour | ||||
| Labour hold | ||||
Plympton Erle (3 seats)
[edit]
| Party | Candidate | Votes | % | |
|---|---|---|---|---|
| Conservative | Kathleen Banks | 2,400 | ||
| Conservative | John Fox | 2,332 | ||
| Conservative | David James | 2,299 | ||
| Labour | S. Dann | 815 | ||
| Labour | M. Hughes | 679 | ||
| Liberal Democrats | K. Hill | 667 | ||
| Labour | A. Mason | 658 | ||
| Liberal Democrats | S. Jennett | 504 | ||
| Liberal Democrats | J. Seed | 407 | ||
| Turnout | 28.2% | |||
| Conservative hold | ||||
| Conservative hold | ||||
| Conservative hold | ||||
Plympton St Mary (3 seats)
[edit]
| Party | Candidate | Votes | % | |
|---|---|---|---|---|
| Conservative | Patrick Nicholson | 2,086 | ||
| Conservative | Delia Ford | 2,011 | ||
| Conservative | Maureen Lawley | 1,728 | ||
| Labour | E. O'Hara | 733 | ||
| Labour | F. Sheaff | 606 | ||
| Labour | W. Wraight | 566 | ||
| Liberal Democrats | A. Cains | 290 | ||
| Liberal Democrats | V. Baharie | 267 | ||
| Turnout | 36.2% | |||
| Conservative hold | ||||
| Conservative hold | ||||
| Conservative hold | ||||
Plymstock Dunstone (3 seats)
[edit]
| Party | Candidate | Votes | % | |
|---|---|---|---|---|
| Conservative | David Viney | 2,885 | ||
| Conservative | Vivien Pengelly | 2,793 | ||
| Conservative | Kevin Wigens | 2,669 | ||
| Labour | J. Kirk | 1,032 | ||
| Labour | V. Burns | 860 | ||
| Labour | L. Stacey | 810 | ||
| Liberal Democrats | J. Coker | 517 | ||
| Liberal Democrats | P. Durrant | 495 | ||
| Liberal Democrats | C. Burrows | 434 | ||
| Turnout | 39.9% | |||
| Conservative hold | ||||
| Conservative hold | ||||
| Conservative hold | ||||
Plymstock Radford (3 seats)
[edit]
| Party | Candidate | Votes | % | |
|---|---|---|---|---|
| Conservative | Kenneth Foster | 1,907 | ||
| Conservative | Wendy Foster | 1,872 | ||
| Conservative | Michael Leaves | 1,786 | ||
| Labour | R. Earl | 1,116 | ||
| Labour | P. Allan | 908 | ||
| Labour | J. Clynch | 883 | ||
| Liberal Democrats | J. Byatt | 696 | ||
| Liberal Democrats | M. Coker | 621 | ||
| Liberal Democrats | A. Nelmes | 592 | ||
| Turnout | 40.9% | |||
| Conservative hold | ||||
| Conservative gain from Labour | ||||
| Conservative gain from Labour | ||||
Southway (3 seats)
[edit]
| Party | Candidate | Votes | % | |
|---|---|---|---|---|
| Labour | Dennis Camp | 1,446 | ||
| Conservative | Janice Harden | 1,399 | ||
| Conservative | Graham Horler | 1,318 | ||
| Labour | A. Bull | 1,306 | ||
| Conservative | E. Willey | 1,288 | ||
| Labour | John George Jones | 1,286 | ||
| Liberal Democrats | M. Trench | 315 | ||
| Turnout | 30.8% | |||
| Labour hold | ||||
| Conservative gain from Labour | ||||
| Conservative gain from Labour | ||||
St Budeax (3 seats)
[edit]
| Party | Candidate | Votes | % | |
|---|---|---|---|---|
| Labour | Brenda Jones | 1,218 | ||
| Labour | Carol Blackburn | 1,181 | ||
| Labour | Thomas Wildy | 1,074 | ||
| Conservative | J. Plymsol | 1,002 | ||
| Conservative | E. Price | 948 | ||
| Conservative | M. Gibson | 925 | ||
| Liberal Democrats | W. Gallagher | 384 | ||
| Turnout | 28.0% | |||
| Labour hold | ||||
| Labour hold | ||||
| Labour hold | ||||
St Peter (3 seats)
[edit]
| Party | Candidate | Votes | % | |
|---|---|---|---|---|
| Labour | Sylvia Bellamy | 1,062 | ||
| Labour | Robert Bellamy | 994 | ||
| Labour | Mark King | 985 | ||
| Conservative | J. Parry | 651 | ||
| Conservative | D. Gamble | 646 | ||
| Conservative | P. Parnall | 637 | ||
| Liberal Democrats | H. Guy | 280 | ||
| Liberal Democrats | P. Jones | 277 | ||
| Turnout | 24.8% | |||
| Labour hold | ||||
| Labour hold | ||||
| Labour hold | ||||
Stoke (3 seats)
[edit]
| Party | Candidate | Votes | % | |
|---|---|---|---|---|
| Conservative | Constance Pascoe | 1,584 | ||
| Conservative | Yvonne Dawson | 1,556 | ||
| Conservative | Grant Monahan | 1,481 | ||
| Labour | David Alexander Millar | 1,237 | ||
| Labour | Janet Millar | 1,182 | ||
| Labour | William John Stevens | 1,172 | ||
| Liberal Democrats | S. Guy | 447 | ||
| Liberal Democrats | J. Evans | 422 | ||
| Turnout | 35.3% | |||
| Conservative gain from Labour | ||||
| Conservative gain from Labour | ||||
| Conservative gain from Labour | ||||
Sutton (3 seats)
[edit]
| Party | Candidate | Votes | % | |
|---|---|---|---|---|
| Conservative | Frederick Brimacombe | 1,188 | ||
| Conservative | Anna Angel | 1,101 | ||
| Labour | Jean Nelder | 1,095 | ||
| Conservative | K. Kelway | 1,071 | ||
| Labour | E. Cohen | 1,031 | ||
| Labour | G. Wheeler | 1,008 | ||
| Liberal Democrats | J. Dean | 320 | ||
| Turnout | 29.5% | |||
| Conservative gain from Labour | ||||
| Conservative gain from Labour | ||||
| Labour hold | ||||
Trelawny (3 seats)
[edit]
| Party | Candidate | Votes | % | |
|---|---|---|---|---|
| Conservative | John Mahony | 1,633 | ||
| Conservative | Patricia Nicholson | 1,620 | ||
| Conservative | David Birkenhead | 1,565 | ||
| Labour | R. Rogers | 1,138 | ||
| Labour | G. Shears | 1,113 | ||
| Labour | V. Woodward | 1,093 | ||
| Liberal Democrats | P. Aldersley | 408 | ||
| Green | F. Allen | 308 | ||
| Turnout | 42.5% | |||
| Conservative gain from Labour | ||||
| Conservative gain from Labour | ||||
| Conservative gain from Labour | ||||
References
[edit]- ^ Rallings, Colin; Thrasher, Michael. Local Elections Handbook 2000 (PDF). Plymouth University, Plymouth, UK: The Elections Centre. p. 9.
- ^ "Local Elections 2000". BBC News.
- ^ "Your Local Councillors". Archived from the original on 12 May 2000. Retrieved 25 November 2019.
- ^ "Plymouth City Council Election Results 1997-2012" (PDF). Elections Centre. Retrieved 21 November 2019.
