2000 City of Lincoln Council election
Appearance
(Redirected from 2000 Lincoln Council election)
| ||||||||||||||||||||||||||||
11 of the 33 seats to City of Lincoln Council 17 seats needed for a majority | ||||||||||||||||||||||||||||
|---|---|---|---|---|---|---|---|---|---|---|---|---|---|---|---|---|---|---|---|---|---|---|---|---|---|---|---|---|
| ||||||||||||||||||||||||||||
 Map showing the results of the 2000 Lincoln City Council elections by ward. Red shows Labour seats and blue shows Conservative seats. | ||||||||||||||||||||||||||||
| ||||||||||||||||||||||||||||
Elections to City of Lincoln Council in Lincolnshire, England, were held on 4 May 2000. One third of the council was up for election and the Labour Party stayed in overall control of the council.
After the election, the composition of the council was:
- Labour 29
- Conservative 4
Election result
[edit]| Party | Seats | Gains | Losses | Net gain/loss | Seats % | Votes % | Votes | +/− | |
|---|---|---|---|---|---|---|---|---|---|
| Labour | 7 | 0 | 2 | 63.6 | 46.7 | 7,095 | |||
| Conservative | 4 | 2 | 0 | 36.4 | 37.6 | 5,725 | |||
| Lincoln Independent Alliance | 0 | 0 | 0 | 0.0 | 10.0 | 1,522 | |||
| Liberal Democrats | 0 | 0 | 0 | 0.0 | 4.5 | 681 | |||
| Green | 0 | 0 | 0 | 0.0 | 1.2 | 184 | |||
Ward results
[edit]Abbey
[edit]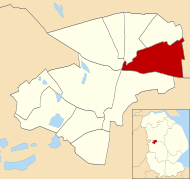
| Party | Candidate | Votes | % | |
|---|---|---|---|---|
| Labour | Fay Smith[5] | 663 | 64.4% | |
| Conservative | J. Gainey | 366 | 35.6% | |
| Turnout | 20.4% | |||
| Labour hold | ||||
Birchwood
[edit]
| Party | Candidate | Votes | % | |
|---|---|---|---|---|
| Conservative | Edmund Strengiel[6] | 672 | 50.9% | |
| Labour | P. Gowen | 560 | 42.5% | |
| Lincoln Independent Alliance | R. Wells | 87 | 6.6% | |
| Turnout | 24.3% | |||
| Conservative hold | ||||
Boultham
[edit]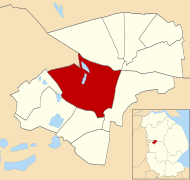
| Party | Candidate | Votes | % | |
|---|---|---|---|---|
| Labour | Ralph Toofany[7] | 749 | 52.1% | |
| Conservative | D. Grice | 327 | 22.7% | |
| Lincoln Independent Alliance | M. Skeels | 240 | 16.7% | |
| Liberal Democrats | D. Paton | 122 | 8.5% | |
| Turnout | 25.2% | |||
| Labour hold | ||||
Bracebridge
[edit]
| Party | Candidate | Votes | % | |
|---|---|---|---|---|
| Conservative | Hilton Spratt[8] | 812 | 47.2% | |
| Labour | A. Taylor | 688 | 40.0% | |
| Liberal Democrats | D. Simpson | 192 | 11.2% | |
| Lincoln Independent Alliance | A. Fletcher | 27 | 1.6% | |
| Turnout | 27.8% | |||
| Conservative gain from Labour | ||||
Carholme
[edit]
| Party | Candidate | Votes | % | |
|---|---|---|---|---|
| Labour | Neil Murray[9] | 695 | 45.4% | |
| Conservative | S. Grice | 364 | 23.8% | |
| Liberal Democrats | L. Gabriel | 239 | 15.6% | |
| Green | N. Watson | 147 | 9.6% | |
| Lincoln Independent Alliance | J. Spencer | 87 | 5.7% | |
| Turnout | 28.8% | |||
| Labour hold | ||||
Castle
[edit]
| Party | Candidate | Votes | % | |
|---|---|---|---|---|
| Labour | Donald Nannestad[10] | 714 | 57.8% | |
| Conservative | B. Hollands | 442 | 35.8% | |
| Lincoln Independent Alliance | L. Openshaw | 80 | 6.5% | |
| Turnout | 23.9% | |||
| Labour hold | ||||
Glebe
[edit]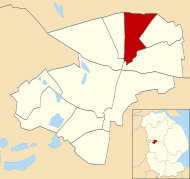
| Party | Candidate | Votes | % | |
|---|---|---|---|---|
| Labour | Lawrence Wells[11] | 692 | 49.7% | |
| Conservative | P. Mappin | 408 | 29.3% | |
| Lincoln Independent Alliance | G. Spencer | 292 | 21.0% | |
| Turnout | 23.7% | |||
| Labour hold | ||||
Hartsholme
[edit]
| Party | Candidate | Votes | % | |
|---|---|---|---|---|
| Conservative | Ronald Hills[12] | 814 | 47.5% | |
| Labour | L. Burke | 535 | 31.2% | |
| Lincoln Independent Alliance | R. Hall | 364 | 21.2% | |
| Turnout | 25.3% | |||
| Conservative gain from Labour | ||||
Minster
[edit]
| Party | Candidate | Votes | % | |
|---|---|---|---|---|
| Conservative | David Gratrick[13] | 757 | 47.4% | |
| Labour | M. Schofield | 601 | 37.7% | |
| Lincoln Independent Alliance | P. Wilkinson | 238 | 14.9% | |
| Turnout | 28.9% | |||
| Conservative hold | ||||
Moorland
[edit]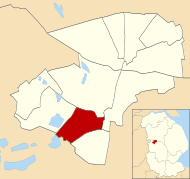
| Party | Candidate | Votes | % | |
|---|---|---|---|---|
| Labour | Denise Moore[14] | 686 | 52.6% | |
| Conservative | D. Fraser | 541 | 41.5% | |
| Lincoln Independent Alliance | J. Webster | 76 | 5.8% | |
| Turnout | 22.8% | |||
| Labour hold | ||||
Park
[edit]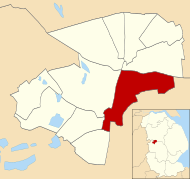
| Party | Candidate | Votes | % | |
|---|---|---|---|---|
| Labour | Patrick Vaughan[15] | 512 | 55.1% | |
| Conservative | B. Briggs | 222 | 23.9% | |
| Liberal Democrats | J. Merian | 128 | 13.8% | |
| Green | K. Yates | 37 | 4.0% | |
| Lincoln Independent Alliance | B. Freeborough | 31 | 3.3% | |
| Turnout | 16.4% | |||
| Labour hold | ||||
References
[edit]- ^ "Council compositions by year". The Elections Centre.
- ^ "Local Election Summaries 2000". The Elections Centre.
- ^ "Council by Council - Lincoln". BBC News. Retrieved 2 November 2019.
- ^ a b c d e f g h i j k "City of Lincoln Council Election Results 1973-2012". Elections Centre. Retrieved 29 October 2019.
- ^ "Councillors - Abbey ward". Archived from the original on 19 April 2003. Retrieved 4 November 2019.
- ^ "City of Lincoln Council - Your council". City of Lincoln Council. Archived from the original on 25 January 2003. Retrieved 4 November 2019.
- ^ "Councillors - Boultham ward". Archived from the original on 19 April 2003. Retrieved 4 November 2019.
- ^ "Councillors - Bracebridge ward". Archived from the original on 19 April 2003. Retrieved 4 November 2019.
- ^ "Councillors - Castle ward". Archived from the original on 25 January 2003. Retrieved 4 November 2019.
- ^ "Councillors - Castle ward". Archived from the original on 19 April 2003. Retrieved 4 November 2019.
- ^ "Councillors - Glebe ward". Archived from the original on 19 April 2003. Retrieved 4 November 2019.
- ^ "Councillors - Hartsholme ward". City of Lincoln Council. Archived from the original on 19 April 2003. Retrieved 4 November 2019.
- ^ "Councillors - Minster ward". Archived from the original on 19 April 2003. Retrieved 4 November 2019.
- ^ "Councillors - Moorland ward". Archived from the original on 19 April 2003. Retrieved 5 November 2019.
- ^ "Councillors - Park ward". Archived from the original on 19 April 2003. Retrieved 5 November 2019.
