From Wikipedia, the free encyclopedia
Part of the 1999 Irish local elections
1999 Carlow County Council election|
|
|
|
|
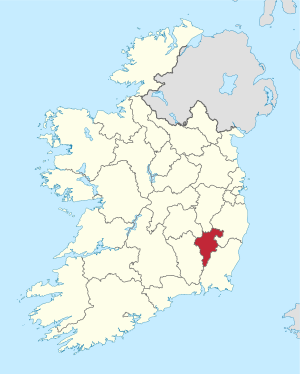
 Map showing the area of Carlow County Council |
|
|
Council control after election
TBD
| |
An election to Carlow County Council took place on 10 June 1999 as part of that year's Irish local elections. 21 councillors were elected from five local electoral areas (LEAs) for a five-year term of office on the electoral system of proportional representation by means of the single transferable vote (PR-STV).
Results by local electoral area
[edit]
Borris - 3 seats
| Party |
Candidate |
FPv% |
Count
|
| 1 |
2 |
3
|
|
|
Green
|
Mary White
|
21.98
|
582
|
627
|
700
|
|
|
Labour
|
Michael Meaney*
|
20.73
|
549
|
584
|
647
|
|
|
Fine Gael
|
Michael Doyle*
|
19.45
|
515
|
550
|
604
|
|
|
Fianna Fáil
|
Dolores Barron
|
16.99
|
450
|
509
|
654
|
|
|
Fianna Fáil
|
Siobhan Minchin
|
13.18
|
349
|
365
|
|
|
|
Independent
|
Bridie Lawlor
|
7.67
|
203
|
|
|
| Electorate: 4,591 Valid: 2,648 (57.68%) Spoilt: 34 Quota: 663 Turnout: 2,682 (58.42%)
|
Carlow No.1 - 3 seats
| Party |
Candidate |
FPv% |
Count
|
| 1 |
2 |
3 |
4
|
|
|
Fianna Fáil
|
Jimmy Murnane*
|
22.78
|
519
|
537
|
655
|
|
|
|
Fianna Fáil
|
Joe McDonald
|
19.80
|
451
|
482
|
517
|
546
|
|
|
Fine Gael
|
Declan Alcock*
|
16.68
|
380
|
471
|
556
|
599
|
|
|
Labour
|
Des Hurley*
|
15.14
|
345
|
370
|
|
|
|
|
Progressive Democrats
|
Senator Jim Gibbons Jnr
|
14.93
|
340
|
395
|
457
|
469
|
|
|
Fine Gael
|
Colette Fennelly
|
10.67
|
243
|
|
|
|
| Electorate: 4,869 Valid: 2,278 (46.79%) Spoilt: 44 Quota: 570 Turnout: 2,322 (47.69%)
|
Muinebheag - 5 seats
| Party |
Candidate |
FPv% |
Count
|
| 1 |
2 |
3 |
4 |
5 |
6 |
7
|
|
|
Labour
|
Jim Townsend*
|
15.23
|
671
|
706
|
719
|
727
|
754
|
|
|
|
|
Fianna Fáil
|
Enda Nolan*
|
13.30
|
586
|
588
|
590
|
621
|
633
|
691
|
776
|
|
|
Fine Gael
|
Denis Foley
|
12.48
|
550
|
552
|
558
|
578
|
640
|
677
|
748
|
|
|
Fianna Fáil
|
Arthur McDonald*
|
10.92
|
481
|
483
|
495
|
540
|
562
|
634
|
690
|
|
|
Labour
|
John Clarke
|
10.05
|
443
|
456
|
468
|
508
|
516
|
528
|
582
|
|
|
Fine Gael
|
Mary McDonald*
|
9.01
|
397
|
405
|
413
|
417
|
486
|
537
|
675
|
|
|
Independent
|
Martin Nevin
|
7.99
|
352
|
355
|
382
|
391
|
410
|
490
|
|
|
|
Fianna Fáil
|
Eddie Cullen
|
7.47
|
329
|
337
|
344
|
348
|
360
|
|
|
|
|
Fine Gael
|
John Hughes
|
5.38
|
237
|
240
|
243
|
247
|
|
|
|
|
|
Fianna Fáil
|
Paddy Kiely
|
3.95
|
174
|
176
|
179
|
|
|
|
|
|
|
Independent
|
John McNally
|
2.32
|
102
|
176
|
179
|
|
|
|
|
|
|
Labour
|
Liz Dunne
|
1.91
|
84
|
|
|
|
|
|
|
| Electorate: 8,148 Valid: 4,406 (54.07%) Spoilt: 77 Quota: 735 Turnout: 4,483 (55.02%)
|
Tullow - 5 seats
| Party |
Candidate |
FPv% |
Count
|
| 1 |
2 |
3 |
4 |
5 |
6 |
7 |
8
|
|
|
Labour
|
William Paton
|
18.11
|
842
|
|
|
|
|
|
|
|
|
|
Fine Gael
|
Fred Hunter*
|
14.54
|
676
|
684
|
691
|
712
|
768
|
915
|
|
|
|
|
Fianna Fáil
|
John Pender*
|
14.00
|
651
|
660
|
673
|
718
|
735
|
825
|
|
|
|
|
Fine Gael
|
Michael Deering*
|
13.31
|
619
|
627
|
639
|
649
|
690
|
860
|
|
|
|
|
Fianna Fáil
|
Noel Kennedy
|
10.71
|
498
|
502
|
505
|
516
|
522
|
531
|
545
|
564
|
|
|
Fianna Fáil
|
P.J. Kavanagh
|
9.92
|
461
|
464
|
468
|
498
|
601
|
627
|
651
|
688
|
|
|
Fine Gael
|
Pat O'Toole*
|
8.52
|
396
|
412
|
431
|
454
|
506
|
|
|
|
|
|
Fine Gael
|
Michael Murphy
|
5.64
|
262
|
263
|
266
|
298
|
|
|
|
|
|
|
Independent
|
Billy Nolan
|
3.61
|
168
|
188
|
194
|
|
|
|
|
|
|
|
Green
|
Danny Kelly
|
1.63
|
76
|
|
|
|
|
|
|
|
| Electorate: 8,611 Valid: 4,649 (53.99%) Spoilt: 72 Quota: 775 Turnout: 4,721 (54.83%)
|

