1959 United Kingdom general election in Scotland
| |||||||||||||||||||||||||||||||||||||||||||||||||||||||||||||||||||||||||||
All 71 Scottish seats to the House of Commons | |||||||||||||||||||||||||||||||||||||||||||||||||||||||||||||||||||||||||||
|---|---|---|---|---|---|---|---|---|---|---|---|---|---|---|---|---|---|---|---|---|---|---|---|---|---|---|---|---|---|---|---|---|---|---|---|---|---|---|---|---|---|---|---|---|---|---|---|---|---|---|---|---|---|---|---|---|---|---|---|---|---|---|---|---|---|---|---|---|---|---|---|---|---|---|---|
| |||||||||||||||||||||||||||||||||||||||||||||||||||||||||||||||||||||||||||
 Results of the 1959 election in Scotland Conservative/Unionist Labour Liberal National Liberal Independent Unionist | |||||||||||||||||||||||||||||||||||||||||||||||||||||||||||||||||||||||||||
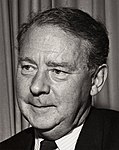
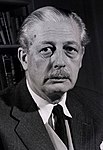
A general election was held in the United Kingdom on Thursday, 8 October 1959 and all 71 seats in Scotland were contested.[1] The Unionists, who alligned with the Conservative and Unionist Party at a UK level, together with their allies the National Liberals, won the largest number of votes, but lost out in seats to the Labour Party. Across the UK as a whole, the Conservatives won 365 seats, and returned as government with a majority of 100 seats.
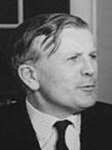
Jo Grimond, now party leader for the Liberals, was returned as his party's only MP, representing Orkney and Shetland. The election also saw David Robertson returned as in "Independent Unionist" for Caithness and Sutherland. Robertson was the sitting MP for the seat, having resigned from taking the Conservative whip at Westminster in January of 1959.[2] Robertson was not opposed by an official Unionist candidate.[3]
MPs
[edit]List of MPs for constituencies in Scotland (1959–1964)
Results
[edit]| Party | Seats | Seats change | Votes | % | % Change | ||
|---|---|---|---|---|---|---|---|
| Labour Party | 38 | 1,245,255 | 46.7 | ||||
| Conservative and Unionist (Total) | 31 | 1,260,287 | 47.3 | ||||
| Unionist | 25 | 1,060,609 | 39.8 | ||||
| National Liberal & Conservative | 6 | 199,678 | 7.5 | ||||
| Liberal | 1 | 108,963 | 4.1 | ||||
| Independent Unionist | 1 | 12,163 | 0.5 | New | |||
| SNP | 0 | 21,738 | 0.8 | ||||
| Communist | 0 | 12,150 | 0.5 | New | |||
| Fife Socialist League | 0 | 4,886 | 0.2 | New | |||
| Other | 0 | 2,071 | 0.1 | ||||
| Total | 71 | 2,667,513 | 100 | ||||
Votes summary
[edit]Notes
[edit]- ^ The seat and vote count figures for the Unionists given here include the National Liberals
References
[edit]- ^ "Commons results report" (PDF). Archived (PDF) from the original on 12 November 2020.
- ^ "Sir D. Robertson Resigns Whip", The Times, 31 January 1959.
- ^ "Conservatives Not Likely To Oppose Sir D. Robertson", The Times, 10 September 1959.


