2010 Vincentian general election
Appearance
(Redirected from Vincentian general election, 2010)
| ||||||||||||||||||||||||||||||||||
15 seats in the House of Assembly 8 seats needed for a majority | ||||||||||||||||||||||||||||||||||
|---|---|---|---|---|---|---|---|---|---|---|---|---|---|---|---|---|---|---|---|---|---|---|---|---|---|---|---|---|---|---|---|---|---|---|
| Turnout | 62.3% ( | |||||||||||||||||||||||||||||||||
| ||||||||||||||||||||||||||||||||||
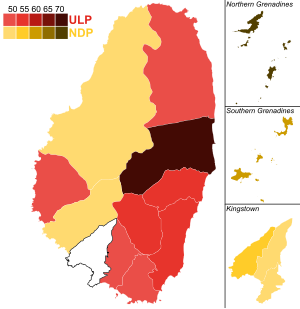
 Results by constituency | ||||||||||||||||||||||||||||||||||
| ||||||||||||||||||||||||||||||||||
 |
|---|
| Administrative divisions (parishes) |
General elections were held in Saint Vincent and the Grenadines on 13 December 2010. The result was a victory for the Unity Labour Party, which won eight of the fifteen seats in the House of Assembly.[1]
Background
[edit]The date of the elections was announced at the Calliaqua Playing Field by Prime Minister Ralph Gonsalves on 14 November 2010. It was also announced that parliament would be dissolved on 15 November and nomination day would be on 26 November.
Campaign
[edit]A total of 44 candidates contested the elections; the Unity Labour Party and the New Democratic Party both fielded a full slate of 15 candidates, whilst the Green Party had 14 candidates.[1]
Results
[edit] | |||||
|---|---|---|---|---|---|
| Party | Votes | % | Seats | +/– | |
| Unity Labour Party | 32,099 | 51.11 | 8 | –4 | |
| New Democratic Party | 30,568 | 48.67 | 7 | +4 | |
| Green Party | 138 | 0.22 | 0 | 0 | |
| Total | 62,805 | 100.00 | 15 | 0 | |
| Valid votes | 62,805 | 99.70 | |||
| Invalid/blank votes | 188 | 0.30 | |||
| Total votes | 62,993 | 100.00 | |||
| Registered voters/turnout | 101,067 | 62.33 | |||
| Source: IPU | |||||
References
[edit]- ^ a b Last elections IPU


