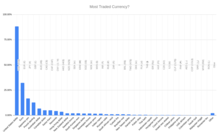
Template:Most traded currencies
Appearance
| Currency | ISO 4217 code |
Symbols | Proportion of daily volume | Change (2019–2022) | |
|---|---|---|---|---|---|
| April 2019 | April 2022 | ||||
| U.S. dollar | USD | $, US$ | 88.3% | 88.5% | |
| Euro | EUR | € | 32.3% | 30.5% | |
| Japanese yen | JPY | ¥, 円 | 16.8% | 16.7% | |
| Sterling | GBP | £ | 12.8% | 12.9% | |
| Renminbi | CNY | ¥, 圆 | 4.3% | 7.0% | |
| Australian dollar | AUD | $, $A | 6.8% | 6.4% | |
| Canadian dollar | CAD | $, Can$ | 5.0% | 6.2% | |
| Swiss franc | CHF | Fr., fr. | 4.9% | 5.2% | |
| Hong Kong dollar | HKD | $, HK$, 元 | 3.5% | 2.6% | |
| Singapore dollar | SGD | $, S$ | 1.8% | 2.4% | |
| Swedish krona | SEK | kr, Skr | 2.0% | 2.2% | |
| South Korean won | KRW | ₩, 원 | 2.0% | 1.9% | |
| Norwegian krone | NOK | kr, Nkr | 1.8% | 1.7% | |
| New Zealand dollar | NZD | $, $NZ | 2.1% | 1.7% | |
| Indian rupee | INR | ₹ | 1.7% | 1.6% | |
| Mexican peso | MXN | $, Mex$ | 1.7% | 1.5% | |
| New Taiwan dollar | TWD | $, NT$, 圓 | 0.9% | 1.1% | |
| South African rand | ZAR | R | 1.1% | 1.0% | |
| Brazilian real | BRL | R$ | 1.1% | 0.9% | |
| Danish krone | DKK | kr., DKr | 0.6% | 0.7% | |
| Polish złoty | PLN | zł, Zl | 0.6% | 0.7% | |
| Thai baht | THB | ฿, B | 0.5% | 0.4% | |
| Israeli new shekel | ILS | ₪, NIS | 0.3% | 0.4% | |
| Indonesian rupiah | IDR | Rp | 0.4% | 0.4% | |
| Czech koruna | CZK | Kč, CZK | 0.4% | 0.4% | |
| UAE dirham | AED | د.إ, Dh(s) | 0.2% | 0.4% | |
| Turkish lira | TRY | ₺, TL | 1.1% | 0.4% | |
| Hungarian forint | HUF | Ft | 0.4% | 0.3% | |
| Chilean peso | CLP | $, Ch$ | 0.3% | 0.3% | |
| Saudi riyal | SAR | ﷼, SRl(s) | 0.2% | 0.2% | |
| Philippine peso | PHP | ₱ | 0.3% | 0.2% | |
| Malaysian ringgit | MYR | RM | 0.2% | 0.2% | |
| Colombian peso | COP | $, Col$ | 0.2% | 0.2% | |
| Russian ruble | RUB | ₽, руб | 1.1% | 0.2% | |
| Romanian leu | RON | —, leu | 0.1% | 0.1% | |
| Peruvian sol | PEN | S/. | 0.1% | 0.1% | |
| Bahraini dinar | BHD | .د.ب, BD | 0.0% | 0.0% | |
| Bulgarian lev | BGN | лв., lv., lev | 0.0% | 0.0% | |
| Argentine peso | ARS | $, Arg$ | 0.1% | 0.0% | |
| Other currencies | 1.8% | 2.3% | |||
| Total: | 200.0% | 200.0% | |||
References
- ^ Triennial Central Bank Survey Foreign exchange turnover in April 2022 (PDF) (Report). Bank for International Settlements. 27 October 2022. p. 12. Archived (PDF) from the original on 2022-10-27.

