São José do Rio Pardo
São José do Rio Pardo | |
|---|---|
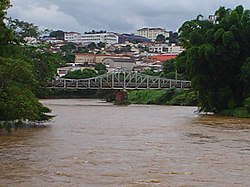
 Bridge at São José do Rio Pardo | |
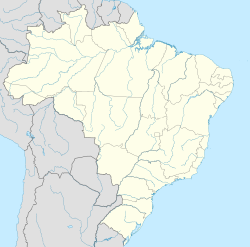
 Location in São Paulo state | |
| Coordinates: 21°35′44″S 46°53′19″W / 21.59556°S 46.88861°W | |
| Country | Brazil |
| Region | Southeast |
| State | São Paulo |
| Area | |
• Total | 419 km2 (162 sq mi) |
| Population (2020 [1]) | |
• Total | 55,124 |
| • Density | 130/km2 (340/sq mi) |
| Time zone | UTC−3 (BRT) |
São José do Rio Pardo is a municipality in the state of São Paulo in Brazil. The population is 55,124 (2020 est.) in an area of 419 km2.[2] The elevation is 676 m. It was founded by Colonel Antônio Marçal Nogueira de Barros in 1870. In the same year, a chapel to Saint Joseph was built. It became a municipality in 1885, when it was separated from Casa Branca.[3] In the late 1800s and the early 1900s the town received a mass of immigration from northern Italy, those immigrants went to town for working in the coffee fields in replacement of the slave workforce, since slaves were set free in 1888 by an act of Princess Elizabeth.
Media
[edit]In telecommunications, the city was served by Telecomunicações de São Paulo.[4] In July 1998, this company was acquired by Telefónica, which adopted the Vivo brand in 2012. The company is currently an operator of cell phones, fixed lines, internet (fiber optics/4G) and television (satellite and cable).[5]
Climate
[edit]| Climate data for São José do Rio Pardo (2008–2020) | |||||||||||||
|---|---|---|---|---|---|---|---|---|---|---|---|---|---|
| Month | Jan | Feb | Mar | Apr | May | Jun | Jul | Aug | Sep | Oct | Nov | Dec | Year |
| Mean daily maximum °C (°F) | 30.1 (86.2) |
30.5 (86.9) |
29.5 (85.1) |
28.6 (83.5) |
26.0 (78.8) |
25.2 (77.4) |
25.8 (78.4) |
27.3 (81.1) |
29.7 (85.5) |
30.3 (86.5) |
29.4 (84.9) |
29.9 (85.8) |
28.5 (83.3) |
| Daily mean °C (°F) | 24.6 (76.3) |
24.7 (76.5) |
23.9 (75.0) |
22.2 (72.0) |
19.4 (66.9) |
18.4 (65.1) |
18.4 (65.1) |
19.7 (67.5) |
22.3 (72.1) |
23.7 (74.7) |
23.6 (74.5) |
24.4 (75.9) |
22.1 (71.8) |
| Mean daily minimum °C (°F) | 19.0 (66.2) |
18.8 (65.8) |
18.2 (64.8) |
15.9 (60.6) |
12.8 (55.0) |
11.7 (53.1) |
11.0 (51.8) |
12.0 (53.6) |
14.8 (58.6) |
17.1 (62.8) |
17.8 (64.0) |
18.8 (65.8) |
15.7 (60.2) |
| Average precipitation mm (inches) | 229.1 (9.02) |
137.3 (5.41) |
144.1 (5.67) |
61.7 (2.43) |
42.4 (1.67) |
25.9 (1.02) |
12.4 (0.49) |
19.6 (0.77) |
62.4 (2.46) |
127.3 (5.01) |
155.5 (6.12) |
209.6 (8.25) |
1,227.3 (48.32) |
| Source: Centro Integrado de Informações Agrometeorológicas[6][7][8][9] | |||||||||||||
References
[edit]- ^ IBGE 2020
- ^ Instituto Brasileiro de Geografia e Estatística
- ^ IBGE, history
- ^ "Creation of Telesp - April 12, 1973". www.imprensaoficial.com.br (in Portuguese). Retrieved 2024-06-14.
- ^ "Our History - Telefônica RI". Telefônica. Retrieved 2024-06-14.
- ^ "Temperatura Máxima Mensal". Centro Integrado de Informações Agrometeorológicas. Retrieved 25 August 2024.
- ^ "Temperatura Mínima Mensal" (in Portuguese). Centro Integrado de Informações Agrometeorológicas. Retrieved 25 August 2024.
- ^ "Temperatura Média Mensal" (in Portuguese). Centro Integrado de Informações Agrometeorológicas. Retrieved 25 August 2024.
- ^ "Chuva Mensal" (in Portuguese). Centro Integrado de Informações Agrometeorológicas. Retrieved 25 August 2024.
External links
[edit]


