San Martín, Meta
Appearance
(Redirected from San Martin, Meta)
This article needs additional citations for verification. (January 2021) |
San Martín, Meta | |
|---|---|
Municipality and town | |
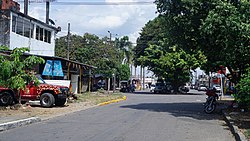
 Calle 9 in San Martin Colombia | |
 Location of the municipality and town of San Martín, Meta in the Meta Department of Colombia. | |
| Country | |
| Department | Meta Department |
| Area | |
| • Total | 6,454 km2 (2,492 sq mi) |
| Elevation | 405 m (1,329 ft) |
| Population (Census 2018[1]) | |
| • Total | 22,281 |
| Time zone | UTC-5 (Colombia Standard Time) |
| Climate | Am |
| Website | www.sanmartin-meta.gov.co/ |
San Martín is a town and municipality in the Meta Department, Colombia.

Climate
[edit]| Climate data for San Martín (Barbasal), elevation 250 m (820 ft), (1981–2010) | |||||||||||||
|---|---|---|---|---|---|---|---|---|---|---|---|---|---|
| Month | Jan | Feb | Mar | Apr | May | Jun | Jul | Aug | Sep | Oct | Nov | Dec | Year |
| Mean daily maximum °C (°F) | 33.3 (91.9) |
33.5 (92.3) |
32.5 (90.5) |
30.9 (87.6) |
30.3 (86.5) |
29.5 (85.1) |
29.5 (85.1) |
30.4 (86.7) |
31.1 (88.0) |
31.2 (88.2) |
31.2 (88.2) |
32.0 (89.6) |
31.2 (88.2) |
| Daily mean °C (°F) | 26.4 (79.5) |
26.6 (79.9) |
26.1 (79.0) |
25.6 (78.1) |
25.2 (77.4) |
24.6 (76.3) |
24.4 (75.9) |
24.9 (76.8) |
25.5 (77.9) |
25.6 (78.1) |
25.7 (78.3) |
26.1 (79.0) |
25.6 (78.1) |
| Mean daily minimum °C (°F) | 20.3 (68.5) |
20.7 (69.3) |
21.4 (70.5) |
21.7 (71.1) |
21.6 (70.9) |
21.2 (70.2) |
21.0 (69.8) |
21.0 (69.8) |
21.1 (70.0) |
21.4 (70.5) |
21.4 (70.5) |
21.0 (69.8) |
21.2 (70.2) |
| Average precipitation mm (inches) | 29.6 (1.17) |
63.5 (2.50) |
189.9 (7.48) |
341.3 (13.44) |
354.9 (13.97) |
353.9 (13.93) |
281.9 (11.10) |
209.4 (8.24) |
187.5 (7.38) |
264.9 (10.43) |
215.3 (8.48) |
55.8 (2.20) |
2,513.2 (98.94) |
| Average precipitation days | 3 | 6 | 13 | 19 | 21 | 22 | 21 | 19 | 15 | 17 | 14 | 7 | 175 |
| Average relative humidity (%) | 76 | 76 | 81 | 85 | 86 | 87 | 87 | 86 | 84 | 84 | 84 | 80 | 83 |
| Mean monthly sunshine hours | 207.7 | 172.2 | 133.3 | 123.0 | 133.3 | 123.0 | 133.3 | 145.7 | 156.0 | 170.5 | 180.0 | 189.1 | 1,867.1 |
| Mean daily sunshine hours | 6.7 | 6.1 | 4.3 | 4.1 | 4.3 | 4.1 | 4.3 | 4.7 | 5.2 | 5.5 | 6.0 | 6.1 | 5.1 |
| Source: Instituto de Hidrologia Meteorologia y Estudios Ambientales[2] | |||||||||||||
References
[edit]- ^ "Censo Nacional de Población y Vivienda 2018" (in Spanish). Retrieved 20 April 2020.
- ^ "Promedios Climatológicos 1981–2010" (in Spanish). Instituto de Hidrologia Meteorologia y Estudios Ambientales. Archived from the original on 15 August 2016. Retrieved 17 June 2024.
3°41′40″N 73°41′37″W / 3.69444°N 73.6936°W


