Bathymetry
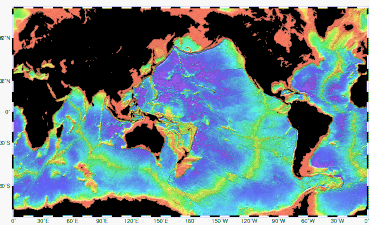
Bathymetry (/bəˈθɪmətri/; from Ancient Greek βαθύς (bathús) 'deep' and μέτρον (métron) 'measure')[1][2] is the study of underwater depth of ocean floors (seabed topography), lake floors, or river floors. In other words, bathymetry is the underwater equivalent to hypsometry or topography. The first recorded evidence of water depth measurements are from Ancient Egypt over 3000 years ago.[3]
Bathymetric charts (not to be confused with hydrographic charts), are typically produced to support safety of surface or sub-surface navigation, and usually show seafloor relief or terrain as contour lines (called depth contours or isobaths) and selected depths (soundings), and typically also provide surface navigational information. Bathymetric maps (a more general term where navigational safety is not a concern) may also use a digital terrain model and artificial illumination techniques to illustrate the depths being portrayed. The global bathymetry is sometimes combined with topography data to yield a global relief model. Paleobathymetry is the study of past underwater depths.
Synonyms include seafloor mapping, seabed mapping, seafloor imaging and seabed imaging. Bathymetric measurements are conducted with various methods, from depth sounding, sonar and lidar techniques, to buoys and satellite altimetry. Various methods have advantages and disadvantages and the specific method used depends upon the scale of the area under study, financial means, desired measurement accuracy, and additional variables. Despite modern computer-based research, the ocean seabed in many locations is less measured than the topography of Mars.[4]
Seabed topography
[edit]
Seabed topography (ocean topography or marine topography) refers to the shape of the land (topography) when it interfaces with the ocean. These shapes are obvious along coastlines, but they occur also in significant ways underwater. The effectiveness of marine habitats is partially defined by these shapes, including the way they interact with and shape ocean currents, and the way sunlight diminishes when these landforms occupy increasing depths. Tidal networks depend on the balance between sedimentary processes and hydrodynamics however, anthropogenic influences can impact the natural system more than any physical driver.[5]
Marine topographies include coastal and oceanic landforms ranging from coastal estuaries and shorelines to continental shelves and coral reefs. Further out in the open ocean, they include underwater and deep sea features such as ocean rises and seamounts. The submerged surface has mountainous features, including a globe-spanning mid-ocean ridge system, as well as undersea volcanoes,[6] oceanic trenches, submarine canyons, oceanic plateaus and abyssal plains.
The mass of the oceans is approximately 1.35×10¹⁸ metric tons, or about 1/4400 of the total mass of the Earth. The oceans cover an area of 3.618×10⁸ km2 with a mean depth of 3,682 m, resulting in an estimated volume of 1.332×10⁹ km3.[7]Measurement
[edit]
Originally, bathymetry involved the measurement of ocean depth through depth sounding. Early techniques used pre-measured heavy rope or cable lowered over a ship's side.[8] This technique measures the depth only a singular point at a time, and is therefore inefficient. It is also subject to movements of the ship and currents moving the line out of true and therefore is not accurate.
The data used to make bathymetric maps today typically comes from an echosounder (sonar) mounted beneath or over the side of a boat, "pinging" a beam of sound downward at the seafloor or from remote sensing LIDAR or LADAR systems.[9] The amount of time it takes for the sound or light to travel through the water, bounce off the seafloor, and return to the sounder informs the equipment of the distance to the seafloor. LIDAR/LADAR surveys are usually conducted by airborne systems.


Starting in the early 1930s, single-beam sounders were used to make bathymetry maps. Today, multibeam echosounders (MBES) are typically used, which use hundreds of very narrow adjacent beams (typically 256) arranged in a fan-like swath of typically 90 to 170 degrees across. The tightly packed array of narrow individual beams provides very high angular resolution and accuracy. In general, a wide swath, which is depth dependent, allows a boat to map more seafloor in less time than a single-beam echosounder by making fewer passes. The beams update many times per second (typically 0.1–50 Hz depending on water depth), allowing faster boat speed while maintaining 100% coverage of the seafloor. Attitude sensors allow for the correction of the boat's roll and pitch on the ocean surface, and a gyrocompass provides accurate heading information to correct for vessel yaw. (Most modern MBES systems use an integrated motion-sensor and position system that measures yaw as well as the other dynamics and position.) A boat-mounted Global Positioning System (GPS) (or other Global Navigation Satellite System (GNSS)) positions the soundings with respect to the surface of the earth. Sound speed profiles (speed of sound in water as a function of depth) of the water column correct for refraction or "ray-bending" of the sound waves owing to non-uniform water column characteristics such as temperature, conductivity, and pressure. A computer system processes all the data, correcting for all of the above factors as well as for the angle of each individual beam. The resulting sounding measurements are then processed either manually, semi-automatically or automatically (in limited circumstances) to produce a map of the area. As of 2010[update] a number of different outputs are generated, including a sub-set of the original measurements that satisfy some conditions (e.g., most representative likely soundings, shallowest in a region, etc.) or integrated digital terrain models (DTM) (e.g., a regular or irregular grid of points connected into a surface). Historically, selection of measurements was more common in hydrographic applications while DTM construction was used for engineering surveys, geology, flow modeling, etc. Since c. 2003–2005, DTMs have become more accepted in hydrographic practice.
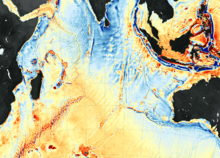
Satellites are also used to measure bathymetry. Satellite radar maps deep-sea topography by detecting the subtle variations in sea level caused by the gravitational pull of undersea mountains, ridges, and other masses. On average, sea level is higher over mountains and ridges than over abyssal plains and trenches.[10]
In the United States the United States Army Corps of Engineers performs or commissions most surveys of navigable inland waterways, while the National Oceanic and Atmospheric Administration (NOAA) performs the same role for ocean waterways. Coastal bathymetry data is available from NOAA's National Geophysical Data Center (NGDC),[11] which is now merged into National Centers for Environmental Information. Bathymetric data is usually referenced to tidal vertical datums.[12] For deep-water bathymetry, this is typically Mean Sea Level (MSL), but most data used for nautical charting is referenced to Mean Lower Low Water (MLLW) in American surveys, and Lowest Astronomical Tide (LAT) in other countries. Many other datums are used in practice, depending on the locality and tidal regime.
Occupations or careers related to bathymetry include the study of oceans and rocks and minerals on the ocean floor, and the study of underwater earthquakes or volcanoes. The taking and analysis of bathymetric measurements is one of the core areas of modern hydrography, and a fundamental component in ensuring the safe transport of goods worldwide.[8]
Satellite imagery
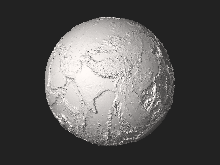
[edit]Another form of mapping the seafloor is through the use of satellites. The satellites are equipped with hyper-spectral and multi-spectral sensors which are used to provide constant streams of images of coastal areas providing a more feasible method of visualising the bottom of the seabed.[13]
Hyper-spectral sensors
[edit]The data-sets produced by hyper-spectral (HS) sensors tend to range between 100 and 200 spectral bands of approximately 5–10 nm bandwidths. Hyper-spectral sensing, or imaging spectroscopy, is a combination of continuous remote imaging and spectroscopy producing a single set of data.[13] Two examples of this kind of sensing are AVIRIS (airborne visible/infrared imaging spectrometer) and HYPERION.
The application of HS sensors in regards to the imaging of the seafloor is the detection and monitoring of chlorophyll, phytoplankton, salinity, water quality, dissolved organic materials, and suspended sediments. However, this does not provide a great visual interpretation of coastal environments.[13][clarification needed]
Multi-spectral sensors
[edit]The other method of satellite imaging, multi-spectral (MS) imaging, tends to divide the EM spectrum into a small number of bands, unlike its partner hyper-spectral sensors which can capture a much larger number of spectral bands.
MS sensing is used more in the mapping of the seabed due to its fewer spectral bands with relatively larger bandwidths. The larger bandwidths allow for a larger spectral coverage, which is crucial in the visual detection of marine features and general spectral resolution of the images acquired.[13][clarification needed]
Airborne laser bathymetry
[edit]High-density airborne laser bathymetry (ALB) is a modern, highly technical, approach to the mapping the seafloor. First developed in the 1960s and 1970s,[citation needed] ALB is a "light detection and ranging (LiDAR) technique that uses visible, ultraviolet, and near infrared light to optically remote sense a contour target through both an active and passive system." What this means is that airborne laser bathymetry also uses light outside the visible spectrum to detect the curves in underwater landscape.[13]
LiDAR (light detection and ranging) is, according to the National Oceanic and Atmospheric Administration, "a remote sensing method that uses light in the form of a pulsed laser to measure distances".[14] These light pulses, along with other data, generate a three-dimensional representation of whatever the light pulses reflect off, giving an accurate representation of the surface characteristics. A LiDAR system usually consists of a laser, scanner, and GPS receiver. Airplanes and helicopters are the most commonly used platforms for acquiring LIDAR data over broad areas. One application of LiDAR is bathymetric LiDAR, which uses water-penetrating green light to also measure seafloor and riverbed elevations.[14]
ALB generally operates in the form of a pulse of non-visible light being emitted from a low-flying aircraft and a receiver recording two reflections from the water. The first of which originates from the surface of the water, and the second from the seabed. This method has been used in a number of studies to map segments of the seafloor of various coastal areas.[15][16][17]
Examples of commercial LIDAR bathymetry systems
[edit]There are various LIDAR bathymetry systems that are commercially accessible. Two of these systems are the Scanning Hydrographic Operational Airborne Lidar Survey (SHOALS) and the Laser Airborne Depth Sounder (LADS). SHOALS was first developed to help the United States Army Corps of Engineers (USACE) in bathymetric surveying by a company called Optech in the 1990s. SHOALS is done through the transmission of a laser, of wavelength between 530 and 532 nm, from a height of approximately 200 m at speed of 60 m/s on average.[18]
High resolution orthoimagery
[edit]High resolution orthoimagery (HRO) is the process of creating an image that combines the geometric qualities with the characteristics of photographs. The result of this process is an orthoimage, a scale image which includes corrections made for feature displacement such as building tilt. These corrections are made through the use of a mathematical equation, information on sensor calibration, and the application of digital elevation models.[19]
An orthoimage can be created through the combination of a number of photos of the same target. The target is photographed from a number of different angles to allow for the perception of the true elevation and tilting of the object. This gives the viewer an accurate perception of the target area.[19]
High resolution orthoimagery is currently being used in the 'terrestrial mapping program', the aim of which is to 'produce high resolution topography data from Oregon to Mexico'. The orthoimagery will be used to provide the photographic data for these regions.[20]
History
[edit]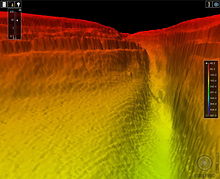
The earliest known depth measurements were made about 1800 BCE by Egyptians by probing with a pole. Later a weighted line was used, with depths marked off at intervals. This process was known as sounding. Both these methods were limited by being spot depths, taken at a point, and could easily miss significant variations in the immediate vicinity. Accuracy was also affected by water movement–current could swing the weight from the vertical and both depth and position would be affected. This was a laborious and time-consuming process and was strongly affected by weather and sea conditions.[21]
There were significant improvements with the voyage of HMS Challenger in the 1870s, when similar systems using wires and a winch were used for measuring much greater depths than previously possible, but this remained a one depth at a time procedure which required very low speed for accuracy.[22] Greater depths could be measured using weighted wires deployed and recovered by powered winches. The wires had less drag and were less affected by current, did not stretch as much, and were strong enough to support their own weight to considerable depths. The winches allowed faster deployment and recovery, necessary when the depths measured were of several kilometers. Wire drag surveys continued to be used until the 1990s due to reliability and accuracy. This procedure involved towing a cable by two boats, supported by floats and weighted to keep a constant depth The wire would snag on obstacles shallower than the cable depth. This was very useful for finding navigational hazards which could be missed by soundings, but was limited to relatively shallow depths.[21]
Single-beam echo sounders were used from the 1920s-1930s to measure the distance of the seafloor directly below a vessel at relatively close intervals along the line of travel. By running roughly parallel lines, data points could be collected at better resolution, but this method still left gaps between the data points, particularly between the lines.[21] The mapping of the sea floor started by using sound waves, contoured into isobaths and early bathymetric charts of shelf topography. These provided the first insight into seafloor morphology, though mistakes were made due to horizontal positional accuracy and imprecise depths. Sidescan sonar was developed in the 1950s to 1970s and could be used to create an image of the bottom, but the technology lacked the capacity for direct depth measurement across the width of the scan. In 1957, Marie Tharp, working with Bruce Charles Heezen, created the first three-dimensional physiographic map of the world's ocean basins. Tharp's discovery was made at the perfect time. It was one of many discoveries that took place near the same time as the invention of the computer. Computers, with their ability to compute large quantities of data, have made research much easier, include the research of the world's oceans. The development of multibeam systems made it possible to obtain depth information across the width of the sonar swath, to higher resolutions, and with precise position and attitude data for the transducers, made it possible to get multiple high resolution soundings from a single pass.[21]
The US Naval Oceanographic Office developed a classified version of multibeam technology in the 1960s. NOAA obtained an unclassified commercial version in the late 1970s and established protocols and standards. Data acquired with multibeam sonar have vastly increased understanding of the seafloor.[21]
The U.S. Landsat satellites of the 1970s and later the European Sentinel satellites, have provided new ways to find bathymetric information, which can be derived from satellite images. These methods include making use of the different depths to which different frequencies of light penetrate the water. When water is clear and the seafloor is sufficiently reflective, depth can be estimated by measuring the amount of reflectance observed by a satellite and then modeling how far the light should penetrate in the known conditions. The Advanced Topographic Laser Altimeter System (ATLAS) on NASA's Ice, Cloud, and land Elevation Satellite 2 (ICESat-2) is a photon-counting lidar that uses the return time of laser light pulses from the Earth's surface to calculate altitude of the surface. ICESat-2 measurements can be combined with ship-based sonar data to fill in gaps and improve precision of maps of shallow water.[23]
Mapping of continental shelf seafloor topography using remotely sensed data has applied a variety of methods to visualise the bottom topography. Early methods included hachure maps, and were generally based on the cartographer's personal interpretation of limited available data. Acoustic mapping methods developed from military sonar images produced a more vivid picture of the seafloor. Further development of sonar based technology have allowed more detail and greater resolution, and ground penetrating techniques provide information on what lies below the bottom surface. Airborne and satellite data acquisition have made further advances possible in visualisation of underwater surfaces: high-resolution aerial photography and orthoimagery is a powerful tool for mapping shallow clear waters on continental shelves, and airborne laser bathymetry, using reflected light pulses, is also very effective in those conditions, and hyperspectral and multispectral satellite sensors can provide a nearly constant stream of benthic environmental information. Remote sensing techniques have been used to develop new ways of visualizing dynamic benthic environments from general geomorphological features to biological coverage.[24]
Charts
[edit]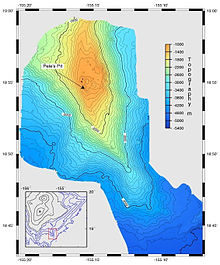
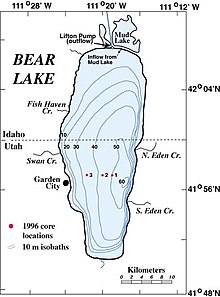
A bathymetric chart is a type of isarithmic map that depicts the submerged bathymetry and physiographic features of ocean and sea bottoms.[25] Their primary purpose is to provide detailed depth contours of ocean topography as well as provide the size, shape and distribution of underwater features.
Topographic maps display elevation above ground (topography) and are complementary to bathymetric charts. Bathymeric charts showcase depth using a series of lines and points at equal intervals, called depth contours or isobaths (a type of contour line). A closed shape with increasingly smaller shapes inside of it can indicate an ocean trench or a seamount, or underwater mountain, depending on whether the depths increase or decrease going inward.[26]
Bathymetric surveys and charts are associated with the science of oceanography, particularly marine geology, and underwater engineering or other specialized purposes.
See also
[edit]- Acoustic seabed classification – Partitioning of a seabed acoustic image into discrete physical entities or classes
- Bathometer – A scientific instrument for measuring water depth
- Bathymetric chart – Map depicting the submerged terrain of bodies of water
- Coastal morphodynamics – Interaction of shoreline seafloor topography and fluid hydrodynamic processes
- Depth gauge – Instrument that indicates depth below a reference surface
- General Bathymetric Chart of the Oceans – Publicly available bathymetric chart of the world's oceans
- Global relief model – Model of Earth's relief including elevation and depth underwater
- Hydrographic survey – Science of measurement and description of features which affect maritime activities
- Ocean surface topography – Shape of the ocean surface relative to the geoid
- Seabed – The bottom of an ocean
- Terrain – Dimension and shape of land surfaces
- Thalweg – Line of lowest elevation in a watercourse or valley
References
[edit]- ^ βαθύς, Henry George Liddell, Robert Scott, A Greek-English Lexicon, on Perseus
- ^ μέτρον, Henry George Liddell, Robert Scott, A Greek-English Lexicon, on Perseus
- ^ Wölfl, A.C.; Snaith, H.; Amirebrahimi, S.; et al. (2019). "Seafloor Mapping – The Challenge of a Truly Global Ocean Bathymetry". Frontiers in Marine Science. 6: 283. doi:10.3389/fmars.2019.00283.
- ^ Jones, E.J.W. (1999). Marine geophhysics. New York: Wiley.
- ^ Giovanni Coco, Z. Zhou, B. van Maanen, M. Olabarrieta, R. Tinoco, I. Townend. Morphodynamics of tidal networks: Advances and challenges. Marine Geology Journal. 1 December 2013.
- ^ Sandwell, D. T.; Smith, W. H. F. (2006-07-07). "Exploring the Ocean Basins with Satellite Altimeter Data". NOAA/NGDC. Retrieved 2007-04-21.
- ^ Charette, Matthew A.; Smith, Walter H. F. (June 2010). "The Volume of Earth's Ocean". Oceanography. 23 (2): 112–114. doi:10.5670/oceanog.2010.51. hdl:1912/3862.
- ^ a b Audrey, Furlong (November 7, 2018). "NGA Explains: What is hydrography?". National Geospatial-Intelligence Agency via YouTube.
- ^ Olsen, R. C. (2007), Remote Sensing from Air and Space (PDF), SPIE, ISBN 978-0-8194-6235-0
- ^ Thurman, H. V. (1997), Introductory Oceanography, New Jersey, USA: Prentice Hall College, ISBN 0-13-262072-3
- ^ "Bathymetry and Global Relief". www.ngdc.noaa.gov. NOAA National Centers for Environmental Information. Retrieved 8 July 2022.
- ^ "Coastal Elevation Models". www.ngdc.noaa.gov. NOAA National Centers for Environmental Information. 15 September 2020. Retrieved 8 July 2022.
- ^ a b c d e Charles W. Finkl, ed., 2016, Seafloor Mapping Along Continental Shelves: Research and Techniques for Visualizing Benthic Environments. Internet resource edition. Volume 13. pp. 31–35
- ^ a b National Oceanic and Atmospheric Administration (NOAA) (15 April 2020). "What is LIDAR?". National Ocean Service. Retrieved 21 June 2020.
- ^ Brock & Purkis (2009). "The emerging role of Lidar remote sensing in coastal research and resource management". In: Brock J, Purkis S (eds.). "Coastal applications of airborne lidar". Journal of Coastal Research, Special Issue No. 53: pp. 1–5
- ^ Bukata et al. (1995) Optical properties and remote sensing of inland and coastal waters. CRC Press, Boca Raton, p. 365
- ^ Deronde et al. (2008). "Monitoring of the sediment dynamics along a sandy shoreline by means of airborne hyper-spectral remote sensing and LIDAR: a case study in Belgium". Earth Surface Processes 33: pp. 280–294
- ^ Charles W. Finkl, ed., 2016, Seafloor Mapping Along Continental Shelves: Research and Techniques for Visualizing Benthic Environments. Internet resource edition. Volume 13. p. 23
- ^ a b USGS, Date Last Edited 2015, High Resolution Orthoimagery (HRO), https://lta.cr.usgs.gov/high_res_ortho
- ^ State of California Ocean Protection Council, 2009, Mapping California's Resources,http://www.opc.ca.gov/2009/12/mapping/
- ^ a b c d e "Underwater Frontiers: A Brief History of Seafloor Mapping". www.arcgis.com. NCEI: National Centers for Environmental Information. Retrieved 8 July 2022.
- ^ Wölfl, Anne-Cathrin; Snaith, Helen; Amirebrahimi, Sam; Devey, Colin W.; Dorschel, Boris; Ferrini, Vicki; Huvenne, Veerle A. I.; Jakobsson, Martin; Jencks, Jennifer; Johnston, Gordon; Lamarche, Geoffroy; Mayer, Larry; Millar, David; Pedersen, Terje Haga; Picard, Kim; Reitz, Anja; Schmitt, Thierry; Visbeck, Martin; Weatherall, Pauline; Wigley, Rochelle (2019). "Seafloor Mapping – The Challenge of a Truly Global Ocean Bathymetry". Frontiers in Marine Science. 6: 283. doi:10.3389/fmars.2019.00283. ISSN 2296-7745.
- ^ Carlowicz, Michael (2020). "Sounding the Seafloor with Light". earthobservatory.nasa.gov. NASA. Retrieved 8 July 2022.
- ^ Finkl, Charles W.; Makowski, Christopher, eds. (2016). Seafloor Mapping Along Continental Shelves: Research and Techniques for Visualizing Benthic Environments. Coastal Research Library. Vol. 13 (Internet resource ed.). pp. 3–53. doi:10.1007/978-3-319-25121-9. ISBN 978-3-319-25121-9. ISSN 2211-0585. S2CID 132980629.
- ^ "Bathymetric map". Encyclopedia Britannica. Retrieved 2019-12-17.
- ^ "bathymetry". National Geographic Society. 2011-03-24. Retrieved 2019-12-17.
External links
[edit]- Bathymetric Data Viewer from NOAA's NCEI
- Overview for underwater terrain, data formats, etc. (vterrain.org)
- High resolution bathymetry for the Great Barrier Reef and Coral Sea
- A.PO.MA.B.-Academy of Positioning Marine and Bathymetry
- WebMapping Application for searching free and open source Bathymetry datasets
- Interactive Web Map, Set Negative Elevation for Bathymetry
- NOAA Ocean Explorer
- Schmidt Ocean Institute: Seafloor Mapping
- Seafloormapping.co.uk
- Coastal Bathymetry Map for US, Canda, Europe & Australia
- Seabed 2030 Archived 2019-06-16 at the Wayback Machine


