Osečina
Appearance
(Redirected from Osecina)
Osečina
Осечина (Serbian) | |
|---|---|
Town and municipality | |
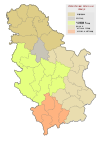
 Location of the municipality of Osečina within Serbia | |
| Coordinates: 44°22′N 19°36′E / 44.367°N 19.600°E | |
| Country | |
| Region | Šumadija and Western Serbia |
| District | Kolubara |
| Settlements | 20 |
| Government | |
| • Mayor | Nikola Tomić (SNS) |
| Area | |
| • Town | 3.43 km2 (1.32 sq mi) |
| • Municipality | 319 km2 (123 sq mi) |
| Elevation | 201 m (659 ft) |
| Population (2022 census)[2] | |
| • Town | 2,456 |
| • Town density | 720/km2 (1,900/sq mi) |
| • Municipality | 9,951 |
| • Municipality density | 31/km2 (81/sq mi) |
| Time zone | UTC+1 (CET) |
| • Summer (DST) | UTC+2 (CEST) |
| Postal code | 14253 |
| Area code | +381(0)14 |
| Car plates | VA |
| Website | www |
Osečina (Serbian Cyrillic: Осечина, pronounced [ɔsɛ̌tʃina]) is a town and municipality located in the Kolubara District of western Serbia. As of 2022, the population of the town is 2,456, while population of the municipality is 9,951 inhabitants.
Settlements
[edit]Apart from the town of Osečina, the municipality consists of the following villages:
Demographics
[edit]| Year | Pop. | ±% p.a. |
|---|---|---|
| 1948 | 23,076 | — |
| 1953 | 23,108 | +0.03% |
| 1961 | 21,803 | −0.72% |
| 1971 | 19,832 | −0.94% |
| 1981 | 18,519 | −0.68% |
| 1991 | 16,745 | −1.00% |
| 2002 | 15,135 | −0.91% |
| 2011 | 12,536 | −2.07% |
| 2022 | 9,951 | −2.08% |
| Source: [3] | ||
According to the 2011 census results, the municipality of Osečina has 12,536 inhabitants.
Ethnic groups
[edit]The ethnic composition of the municipality:[4]
| Ethnic group | Population | % |
|---|---|---|
| Serbs | 12,093 | 96.47% |
| Roma | 228 | 1.82% |
| Macedonians | 7 | 0.06% |
| Croats | 6 | 0.05% |
| Yugoslavs | 6 | 0.05% |
| Others | 196 | 1.56% |
| Total | 12,536 |
Economy
[edit]The following table gives a preview of total number of employed people per their core activity (as of 2017):[5]
| Activity | Total |
|---|---|
| Agriculture, forestry and fishing | 15 |
| Mining | - |
| Processing industry | 729 |
| Distribution of power, gas and water | 18 |
| Distribution of water and water waste management | 48 |
| Construction | 95 |
| Wholesale and retail, repair | 244 |
| Traffic, storage and communication | 42 |
| Hotels and restaurants | 48 |
| Media and telecommunications | 11 |
| Finance and insurance | 9 |
| Property stock and charter | - |
| Professional, scientific, innovative and technical activities | 38 |
| Administrative and other services | 11 |
| Administration and social assurance | 131 |
| Education | 190 |
| Healthcare and social work | 70 |
| Art, leisure and recreation | 22 |
| Other services | 25 |
| Total | 1,747 |
Gallery
[edit]-
Village Osečina
-
Village Osečina
-
Settlement in Osečina
-
Monument dedicated to Nedić brothers who fought in the First Serbian Uprising
-
Monument dedicated to WWII fighters
References
[edit]- ^ "Municipalities of Serbia, 2006". Statistical Office of Serbia. Retrieved 2010-11-28.
- ^ "Census 2022: Total population, by municipalities and cities". popis2022.stat.gov.rs.
- ^ "2011 Census of Population, Households and Dwellings in the Republic of Serbia" (PDF). stat.gov.rs. Statistical Office of the Republic of Serbia. Retrieved 18 August 2017.
- ^ "Population by ethnicity and sex, by municipalities and cities" (PDF). stat.gov.rs. Statistical Office of Serbia. Retrieved 18 August 2017.
- ^ "ОПШТИНЕ И РЕГИОНИ У РЕПУБЛИЦИ СРБИЈИ, 2018" (PDF). stat.gov.rs (in Serbian). Statistical Office of the Republic of Serbia. Retrieved 16 March 2019.
External links
[edit]Wikimedia Commons has media related to Osečina.


