Montelíbano
Appearance
(Redirected from Montelibano)
Montelíbano | |
|---|---|
Municipality and town | |
 | |
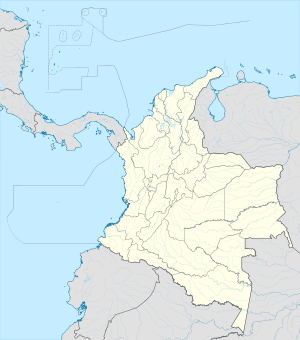
 Location of the municipality and town of Montelíbano in the Córdoba Department of Colombia. | |
| Coordinates: 7°58′30″N 75°25′15″W / 7.97500°N 75.42083°W | |
| Country | |
| Department | Córdoba Department |
| Founded | 1907 |
| Government | |
| • Mayor | José David Cura |
| Area | |
• Municipality and town | 1,551 km2 (599 sq mi) |
| • Urban | 11.08 km2 (4.28 sq mi) |
| Elevation | 44 m (144 ft) |
| Population | |
• Municipality and town | 90,450 |
| • Density | 58/km2 (150/sq mi) |
| • Urban | 63,689 |
| • Urban density | 5,700/km2 (15,000/sq mi) |
| Demonym | Montelíbanés |
| Time zone | UTC-5 (Colombia Standard Time) |
| Postal code | 234001 |
| Area code | 57 + 4 |
| Website | Official website (in Spanish) |
Montelíbano is a town and municipality located in the Córdoba Department of Colombia. It is the seat of the Roman Catholic Diocese of Montelíbano.
Montelíbano is host of one of the largest ferronickel mines, the Cerro Matoso mine. The Company Cerro Matoso S.A. operates the mine site, as well as the associated smelter.
According to 2020 estimates, the population of Montelíbano was 90,450, with a population density of 58 persons per square kilometer.
Climate
[edit]| Climate data for Montelíbano (Cuba Hda), elevation 50 m (160 ft), (1981–2010) | |||||||||||||
|---|---|---|---|---|---|---|---|---|---|---|---|---|---|
| Month | Jan | Feb | Mar | Apr | May | Jun | Jul | Aug | Sep | Oct | Nov | Dec | Year |
| Mean daily maximum °C (°F) | 33.5 (92.3) |
33.7 (92.7) |
33.8 (92.8) |
33.6 (92.5) |
33.1 (91.6) |
32.8 (91.0) |
32.7 (90.9) |
32.7 (90.9) |
32.7 (90.9) |
32.6 (90.7) |
32.6 (90.7) |
32.8 (91.0) |
33.0 (91.4) |
| Daily mean °C (°F) | 27.3 (81.1) |
27.5 (81.5) |
27.6 (81.7) |
27.5 (81.5) |
27.3 (81.1) |
27.2 (81.0) |
27.1 (80.8) |
27.1 (80.8) |
27.0 (80.6) |
27.0 (80.6) |
27.0 (80.6) |
27.2 (81.0) |
27.2 (81.0) |
| Mean daily minimum °C (°F) | 22.3 (72.1) |
22.3 (72.1) |
22.7 (72.9) |
22.9 (73.2) |
22.6 (72.7) |
22.4 (72.3) |
22.5 (72.5) |
22.4 (72.3) |
22.4 (72.3) |
22.6 (72.7) |
22.8 (73.0) |
22.5 (72.5) |
22.5 (72.5) |
| Average precipitation mm (inches) | 14.9 (0.59) |
32.8 (1.29) |
63.0 (2.48) |
173.8 (6.84) |
305.0 (12.01) |
326.7 (12.86) |
359.5 (14.15) |
385.6 (15.18) |
335.8 (13.22) |
292.0 (11.50) |
180.5 (7.11) |
62.3 (2.45) |
2,531.9 (99.68) |
| Average precipitation days | 2 | 3 | 5 | 10 | 16 | 15 | 17 | 17 | 16 | 16 | 11 | 6 | 129 |
| Average relative humidity (%) | 86 | 85 | 84 | 85 | 86 | 86 | 87 | 87 | 87 | 87 | 88 | 88 | 86 |
| Source: Instituto de Hidrologia Meteorologia y Estudios Ambientales[3] | |||||||||||||
References
[edit]- ^ "Resultados y proyecciones (2005-2020) del censo 2005". Retrieved 12 April 2020.
- ^ Citypopulation.de
- ^ "Promedios Climatológicos 1981–2010" (in Spanish). Instituto de Hidrologia Meteorologia y Estudios Ambientales. Archived from the original on 15 August 2016. Retrieved 17 June 2024.
- (in Spanish) Gobernacion de Cordoba - Montelíbano
- (in Spanish) Montelíbano official website
Wikimedia Commons has media related to Montelíbano.
7°58′30″N 75°25′15″W / 7.97500°N 75.42083°W


