2002–03 Football Conference
| Season | 2002–03[1][2] |
|---|---|
| Champions | Yeovil Town (1st Football Conference title) |
| Direct promotion | Yeovil Town |
| Promoted through play-offs | Doncaster Rovers |
| FA Trophy winners | Burscough (Northern Premier League Premier Division) (1st FA Trophy title) |
| Relegated to Level 6 | Kettering Town, Nuneaton Borough, Southport |
| Matches played | 462 |
| Goals scored | 1,342 (2.9 per match) |
| Top goalscorer | Paul Barnes (Doncaster Rovers), 25 |
| Biggest home win | Yeovil – Southport 6–0 (5 October 2002) |
| Biggest away win | Woking – Morecambe 0–6 (22 February 2003) |
| Highest scoring | Burton Albion – Telford 4–7 (8 February 2003) |
| Longest winning run | ? |
| Longest unbeaten run | ? |
| Longest losing run | ? |
| Highest attendance | Yeovil Town v Chester City, 8,111 (26 April 2003) |
| Lowest attendance | ? |
| Average attendance | 1,616 (+ 18% compared with the previous season) |
← 2001–02 2003–04 → | |
The 2002–03 Football Conference season was the 24th season of the Football Conference.
Overview
[edit]This season the number of teams promoted to the Football League Division Three was increased from one to two, and play-offs were introduced to determine the second team to be promoted, along with the Conference champions. The bottom three, as usual, were relegated to either the Northern Premier League, the Southern Premier League or the Isthmian League.
Yeovil Town clinched the league title and won promotion to the Football League Division Three.
Doncaster Rovers also earned promotion to Division Three following their 3–2 play-off win over Dagenham & Redbridge, during extra time with a sudden death goal in the 110th minute.
The regular season began on 17 August 2002, and ended on 26 April 2003.
Changes since the previous season
[edit]- Burton Albion (promoted 2001–02)
- Gravesend & Northfleet (promoted 2001–02)
- Halifax Town (relegated from the Football League 2001–02)
- Kettering Town (promoted 2001–02)
Final league table
[edit]| Pos | Team | Pld | HW | HD | HL | HGF | HGA | AW | AD | AL | AGF | AGA | GD | Pts | Promotion or relegation |
|---|---|---|---|---|---|---|---|---|---|---|---|---|---|---|---|
| 1 | Yeovil Town | 42 | 16 | 5 | 0 | 54 | 13 | 12 | 6 | 3 | 46 | 24 | +63 | 95 | Football Conference Champions, promoted to Football League Division Three |
| 2 | Morecambe | 42 | 17 | 3 | 1 | 52 | 13 | 6 | 6 | 9 | 34 | 29 | +44 | 78 | Participated in play-offs |
| 3 | Doncaster Rovers | 42 | 11 | 6 | 4 | 28 | 17 | 11 | 6 | 4 | 45 | 30 | +26 | 78 | Promoted to Football League Division Three through play-offs |
| 4 | Chester City | 42 | 10 | 6 | 5 | 36 | 21 | 11 | 6 | 4 | 23 | 10 | +28 | 75 | Participated in play-offs |
| 5 | Dagenham & Redbridge | 42 | 12 | 5 | 4 | 38 | 23 | 9 | 4 | 8 | 33 | 36 | +12 | 72 | |
| 6 | Hereford United | 42 | 9 | 5 | 7 | 36 | 22 | 10 | 2 | 9 | 28 | 29 | +13 | 64 | |
| 7 | Scarborough | 42 | 12 | 3 | 6 | 41 | 28 | 6 | 7 | 8 | 22 | 26 | +9 | 64 | |
| 8 | Halifax Town | 42 | 11 | 5 | 5 | 34 | 28 | 7 | 5 | 9 | 16 | 23 | −1 | 64 | Relegated from The Football League |
| 9 | Forest Green Rovers | 42 | 12 | 3 | 6 | 41 | 29 | 5 | 5 | 11 | 20 | 33 | −1 | 59 | |
| 10 | Margate | 42 | 8 | 9 | 4 | 32 | 24 | 7 | 2 | 12 | 28 | 42 | −6 | 56 | |
| 11 | Barnet | 42 | 9 | 4 | 8 | 32 | 28 | 4 | 10 | 7 | 33 | 40 | −3 | 53 | |
| 12 | Stevenage Borough | 42 | 7 | 6 | 8 | 31 | 25 | 7 | 4 | 10 | 30 | 30 | +6 | 52 | |
| 13 | Farnborough Town | 42 | 8 | 6 | 7 | 37 | 29 | 5 | 6 | 10 | 20 | 27 | +1 | 51 | |
| 14 | Northwich Victoria | 42 | 6 | 5 | 10 | 26 | 34 | 7 | 7 | 7 | 40 | 38 | −6 | 51 | |
| 15 | Telford United | 42 | 7 | 2 | 12 | 20 | 33 | 7 | 5 | 9 | 34 | 36 | −15 | 49 | |
| 16 | Burton Albion[a] | 42 | 6 | 6 | 9 | 25 | 31 | 7 | 4 | 10 | 27 | 46 | −25 | 49 | |
| 17 | Gravesend & Northfleet[a] | 42 | 8 | 5 | 8 | 37 | 35 | 4 | 7 | 10 | 25 | 38 | −11 | 48 | |
| 18 | Leigh RMI | 42 | 8 | 5 | 8 | 26 | 34 | 6 | 1 | 14 | 18 | 37 | −27 | 48 | |
| 19 | Woking | 42 | 8 | 7 | 6 | 30 | 35 | 3 | 7 | 11 | 22 | 46 | −29 | 47 | |
| 20 | Nuneaton Borough | 42 | 9 | 4 | 8 | 27 | 32 | 4 | 3 | 14 | 24 | 46 | −27 | 46 | Relegated to Southern League Premier Division |
| 21 | Southport | 42 | 6 | 8 | 7 | 31 | 32 | 5 | 4 | 12 | 23 | 37 | −15 | 45 | Relegated to Northern Premier League Premier Division |
| 22 | Kettering Town[a] | 42 | 4 | 3 | 14 | 23 | 39 | 4 | 4 | 13 | 14 | 34 | −36 | 31 | Relegated to Isthmian League Premier Division |
Notes:
Note: Burscough (Northern Premier League Premier Division) are the FA Trophy winners
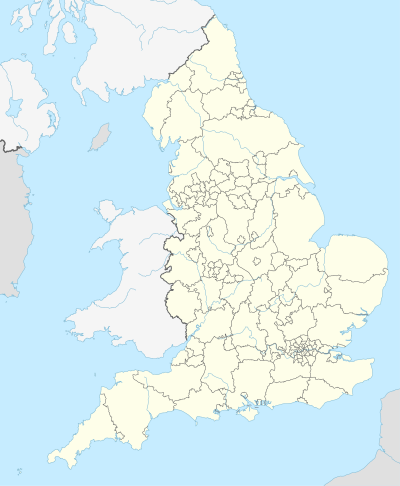
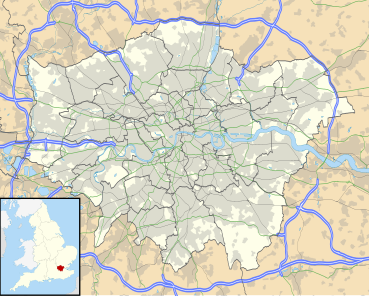
Locations
[edit]Results
[edit]Play-offs
[edit]The Conference National play-offs determine the second team that will be promoted to the Football League Division Three. The teams placed second through fifth qualify for the play-offs. The semi-finals are played in a two-leg, home and away format, while the final is played as one leg, and this season it was held on 10 May 2003 at Britannia Stadium, Stoke, before a crowd of 13,092.
| Semi-finals 1st leg – 1 May 2003; 2nd leg – 5 May 2003 | Final at Britannia Stadium, Stoke-on-Trent 10 May 2003 | ||||||||||
| 3rd | Doncaster Rovers (pen.) | 1 | 1 | 2 (4) | |||||||
| 4th | Chester City | 1 | 1 | 2 (3) | |||||||
| 3rd | Doncaster Rovers (a.e.t.), golden goal) | 3 | |||||||||
| 5th | Dagenham & Redbridge | 2 | |||||||||
| 2nd | Morecambe | 1 | 2 | 3 (2) | |||||||
| 5th | Dagenham & Redbridge (pen.) | 2 | 1 | 3 (3) | |||||||
Source:[1]
Semifinals
[edit]| Doncaster Rovers | 1–1 | Chester City |
|---|---|---|
|
Report |
|
| Chester City | 1–1 (a.e.t.) | Doncaster Rovers |
|---|---|---|
|
Report |
|
| Penalties | ||
| 3–4 | ||
Doncaster Rovers win 4–3 on penalties after tying 2–2 on Aggregate.
| Morecambe | 2–1 (a.e.t.) | Dagenham & Redbridge |
|---|---|---|
|
Report |
|
| Penalties | ||
| 2–3 | ||
Dagenham & Redbridge win 3–2 on penalties after tying 3–3 on Aggregate.
Play-Off Final
[edit]Top scorers in order of league goals
[edit]| Rank | Player | Club | League | Play-offs | FA Cup | FA Trophy | LDV | Total |
|---|---|---|---|---|---|---|---|---|
| 1 | Paul Barnes | Doncaster Rovers | 25 | 1 | 2 | 0 | 0 | 28 |
| 2 | Kirk Jackson | Yeovil Town | 24 | 0 | 1 | 1 | 1 | 27 |
| 3 | Gregg Blundell | Doncaster Rovers | 20 | 0 | 0 | 2 | 0 | 22 |
| 4 | Junior Agogo | Barnet | 20 | 0 | 0 | 0 | 0 | 20 |
| 5 | Wayne Curtis | Morecambe | 18 | 0 | 0 | 0 | 0 | 18 |
| 6 | Dino Maamria | Stevenage Borough | 17 | 0 | 1 | 0 | 0 | 18 |
| = | Daryl Clare | Chester City | 17 | 0 | 0 | 0 | 0 | 17 |
| 8 | Mark Stein | Dagenham & Redbridge | 16 | 3 | 0 | 2 | 0 | 21 |
| = | Christian Moore | Burton Albion | 16 | 0 | 2 | 0 | 0 | 18 |
| = | Steve West | Dagenham & Redbridge | 16 | 0 | 0 | 1 | 0 | 17 |
| = | David Brown | Telford United | 16 | 0 | 0 | 1 | 0 | 17 |
| 12 | Neil Grayson | Forest Green Rovers | 15 | 0 | 0 | 5 | 0 | 20 |
| = | Mark Quayle | Chester City | 15 | 0 | 1 | 0 | 0 | 16 |
| 14 | Warren Patmore | Woking | 14 | 0 | 0 | 2 | 0 | 16 |
| = | Paul Moore | Telford United | 14 | 0 | 0 | 1 | 0 | 15 |
| 16 | Kayode Odejayi | Forest Green Rovers | 13 | 0 | 1 | 2 | 0 | 16 |
| = | Lee Elam | Morecambe | 13 | 0 | 1 | 1 | 0 | 15 |
| = | Kevin Gall | Yeovil Town | 13 | 0 | 0 | 1 | 0 | 14 |
| = | Steve Guinan | Hereford United | 13 | 0 | 0 | 0 | 0 | 13 |
- Footballtransfers.co.uk contains information on many players on whom there is not yet an article in Wikipedia.
Source:[1]


