File talk:World population growth - time between each billion-person growth.svg
Appearance
bad
[edit]The labels for axis on this image are bad. .--------.
The estimation is bad, I didn`t remember exactly, but 2006- 6700 million hab. and 81-83 new hab per year, 2009 --> 7000 million hab. 8 years for the las 1000 million hab, from 12 the last time, is it accelerating?.
   1000. mh -1800,    130 years,     2000 mh - 1930   <----     130
   2000. mh -1930,     30 years,     3000 mh - 1960
   2000. mh -1930,     45 years,     4000 mh - 1975   <----      45
   3000. mh -1960,     15 years,     4000 mh - 1975
   3000. mh -1960,     39 years,     6000 mh - 1999   <----      39
   4000. mh -1975,     12 years,     5000 mh - 1987
   4000. mh -1975,    (43-53)years,  8000 mh - (2018*,2028) <---(43-53)        *At actual rate.
   5000. mh -1987,     12 years,     6000 mh - 1999
   6000. mh -1999,    (10-13)years,  7000 mh - (2009*,1012)
   7000. mh -(2009,2012)(9-14)years, 8000 mh - (2018*,2028)
--SPQRes 21:18, 17 October 2007 (UTC)
Redo request
[edit]| This topic is in need of attention from an expert on the subject. The section or sections that need attention may be noted in a message below. |
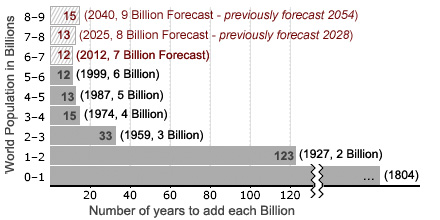
There is no label on the horizontal axis, and there is no number specified for 1800 after the break. Could someone please redo this graph? — Reinyday, 21:30, 8 February 2009 (UTC)
- The estimated dates for milestones achieved and forecast are also now out of date. I've now created and uploaded two fully revised versions of this chart (one with order of bars reversed).
- Incidentally a possible reason why no number is specified for 0-1 Billion bar (previously ending year 1800 but now 1804) is that it is not possible to say how long this milestone took to achieve.... there is much debate about when the "human species" started, e.g. see Homo sapiens. Personally I'd cautiously take the starting point for the 0-1 Billion bar as being around 10,000 BC (please see the Overpopulation Historical Context section I recently added for a brief explanation). Anyhow, as you can see any suggestion of a population starting date and hence number of years to grow it from zero to the first billion is likely to be contentious.
- Here are the new versions of the chart as requested...
- Kind Regards Barryz1 (talk) 01:04, 7 March 2009 (UTC)
- chart is not out of date, at wikipedia.com should forbid such statements. please don`t express your personal opinions. on the other hand there are couple of tings:
1#someone trying to update it right now, has no on-the-spot rules for upload-procss. i remeber uploading a picture by-the-rules which`s got deleted ;
true! graph horizontal and vertical axis must hava same origins . 188.25.53.102 (talk) 22:24, 6 March 2012 (UTC)paul


