Jump to content

File:VennInfo3Var.svg

Page contents not supported in other languages.
This is a file from the Wikimedia Commons
From Wikipedia, the free encyclopedia

Original file (SVG file, nominally 633 × 631 pixels, file size: 21 KB)

Summary

Description
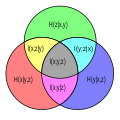
English: Venn diagram of information theoretic measures for three variables x, y, and z. Each circle represents an individual entropy: H(x) is the lower left circle, H(y) the lower right, and H(z) is the upper circle. The intersections of any two circles represents the Mutual information for the associated variables (e.g. I(x;z) is yellow and gray). The union of any two circles is the Joint entropy for the two associated variables (e.g. H(x,y) is everything but green). The joint entropy H(x,y,z) of all three variables is the union of all three circles. It is partitioned into 7 pieces, red, blue, and green being the conditional entropies H(x|y,z), H(y|x,z), H(z|x,y) respectively, yellow, magenta and cyan being the conditional mutual informations I(x;z|y), I(y;z|x) and I(x;y|z) respectively, and gray being the Multivariate mutual information I(x;y;z). The multivariate mutual information is the only one of all that may be negative.
Date
Source Own work
Author PAR
SVG development
InfoField
 
The SVG code is valid.
 
This diagram was created with Inkscape.
 
 This diagram uses embedded text that can be easily translated using a text editor.

References

Cerf, Nicolas J. (1998). "Information theory of quantum entanglement and measurement". Physica D 120: 62-81. Elsevier.

Cerf, Nicolas J. (1997). "Entropic Bell inequalities". Phys. Rev. A 55 (5): 3371. American Physical Society.

Licensing

I, the copyright holder of this work, hereby publish it under the following license:
Creative Commons CC-Zero This file is made available under the Creative Commons CC0 1.0 Universal Public Domain Dedication.
The person who associated a work with this deed has dedicated the work to the public domain by waiving all of their rights to the work worldwide under copyright law, including all related and neighboring rights, to the extent allowed by law. You can copy, modify, distribute and perform the work, even for commercial purposes, all without asking permission.

Captions

Add a one-line explanation of what this file represents

Items portrayed in this file

depicts

16 May 2015

image/svg+xml

File history

Click on a date/time to view the file as it appeared at that time.

Date/TimeThumbnailDimensionsUserComment
current02:03, 9 April 2021Thumbnail for version as of 02:03, 9 April 2021633 × 631 (21 KB)ShyamalFix colors
03:01, 12 November 2019Thumbnail for version as of 03:01, 12 November 2019633 × 631 (9 KB)ShyamalUniform fonts
02:36, 12 November 2019Thumbnail for version as of 02:36, 12 November 2019633 × 631 (5 KB)ShyamalFix typo introduced while derasterizing
03:16, 5 November 2019Thumbnail for version as of 03:16, 5 November 2019633 × 631 (9 KB)ShyamalRemove binary objects
03:12, 5 November 2019Thumbnail for version as of 03:12, 5 November 2019633 × 631 (37 KB)Shyamalderasterize
01:25, 17 May 2015Thumbnail for version as of 01:25, 17 May 2015633 × 631 (28 KB)PAR{{Information |Description ={{en|1=Venn diagram of information theoretic measures for three variables. Each circle represents an individual entropy]: H(x) is the lower left circle, H(y) the lower right, and...

Global file usage

The following other wikis use this file:

Metadata