Jump to content

File:Vector Field on a Sphere.png

Page contents not supported in other languages.
This is a file from the Wikimedia Commons
From Wikipedia, the free encyclopedia

Original file (1,200 × 1,200 pixels, file size: 439 KB, MIME type: image/png)

This image could be re-created using vector graphics as an SVG file. This has several advantages; see Commons:Media for cleanup for more information. If an SVG form of this image is available, please upload it and afterwards replace this template with {{vector version available|new image name}}.


It is recommended to name the SVG file “Vector Field on a Sphere.svg”—then the template Vector version available (or Vva) does not need the new image name parameter.

Summary

Description
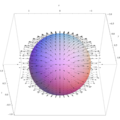
English: The vector field represented by plotted over the unit sphere. Vectors have been uniformly scaled down to 0.2 times their original length for aesthetics. Originally created as an image for the example problem on the divergence theorem page to replace the less relevant image here.
Date
Source Own work
Author Glosser.ca
Other versions
This math image could be re-created using vector graphics as an SVG file. This has several advantages; see Commons:Media for cleanup for more information. If an SVG form of this image is available, please upload it and afterwards replace this template with {{vector version available|new image name}}.


It is recommended to name the SVG file “Vector Field on a Sphere.svg”—then the template Vector version available (or Vva) does not need the new image name parameter.

Licensing

Public domain I, the copyright holder of this work, release this work into the public domain. This applies worldwide.
In some countries this may not be legally possible; if so:
I grant anyone the right to use this work for any purpose, without any conditions, unless such conditions are required by law.

Mathematica 7.0 Source

scaling = 0.2;
stepSize = 1/10;

makeVectors[data_, f_] := Map[{Arrowheads[0.01], Arrow[{#, # + scaling*f @@ #}]} &, data]
upperHemi[x_, y_] := Sqrt[1 - x^2 - y^2]
lowerHemi[x_, y_] := -Sqrt[1 - x^2 - y^2]
f[x_, y_, z_] := {2 x, y^2, z^2}

upperPoints = 
  Flatten[Table[{x, y, upperHemi[x, y]}, {x, -1, 1, 
     stepSize}, {y, -Sqrt[1 - x^2], Sqrt[1 - x^2], stepSize}], 1] ;
lowerPoints = 
  Flatten[Table[{x, y, lowerHemi[x, y]}, {x, -1, 1, 
     stepSize}, {y, -Sqrt[1 - x^2], Sqrt[1 - x^2], stepSize}], 1];

upperVectors = makeVectors[upperPoints, f];
lowerVectors = makeVectors[lowerPoints, f];

Graphics3D[{{Opacity[0.8], Sphere[]}, {Opacity[0.7], 
   upperVectors~Join~lowerVectors}}, ViewPoint -> {Back, Top}, 
 Axes -> True, AxesLabel -> {x, y, z}, LabelStyle -> Directive[Large],
  ImageSize -> {1200, 1200}]

Captions

Add a one-line explanation of what this file represents

Items portrayed in this file

depicts

5 November 2011

File history

Click on a date/time to view the file as it appeared at that time.

Date/TimeThumbnailDimensionsUserComment
current00:53, 5 November 2011Thumbnail for version as of 00:53, 5 November 20111,200 × 1,200 (439 KB)Rayhem

The following page uses this file:

Global file usage

The following other wikis use this file:

Metadata