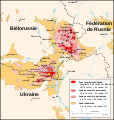
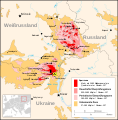
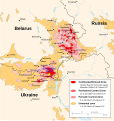
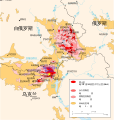
File:Tchernobyl radiation 1996.svg
Appearance

Size of this PNG preview of this SVG file: 568 × 600 pixels. Other resolutions: 227 × 240 pixels | 455 × 480 pixels | 727 × 768 pixels | 970 × 1,024 pixels | 1,940 × 2,048 pixels | 1,398 × 1,476 pixels.
Original file (SVG file, nominally 1,398 × 1,476 pixels, file size: 421 KB)
File history
Click on a date/time to view the file as it appeared at that time.
| Date/Time | Thumbnail | Dimensions | User | Comment | |
|---|---|---|---|---|---|
| current | 13:28, 17 April 2008 |  | 1,398 × 1,476 (421 KB) | Sting | Scale labels in text format |
| 12:17, 18 October 2007 |  | 1,398 × 1,476 (444 KB) | Sting | Correction of the data for the lower radiation level : right, I didn't pay attention, the source map has that error too | |
| 01:19, 5 February 2006 |  | 1,398 × 1,476 (442 KB) | Sting | Font type for "Tchernobyl" | |
| 00:48, 5 February 2006 |  | 1,398 × 1,476 (442 KB) | Sting | Text rendering correction | |
| 00:27, 5 February 2006 |  | 980 × 1,035 (442 KB) | Sting | Size of document correction | |
| 23:37, 4 February 2006 |  | 744 × 1,052 (441 KB) | Sting | {{en}} ''Note : this « svg » map is with French caption and can be used to create a version in another language. For an original map in English, see :'' en:Image:Chornobyl_radiation_map.jpg * '''Subject :''' Radiation hotspots of Cesium-137 in |
File usage
No pages on the English Wikipedia use this file (pages on other projects are not listed).
Global file usage
The following other wikis use this file:
- Usage on ar.wikipedia.org
- Usage on bat-smg.wikipedia.org
- Usage on bg.wikipedia.org
- Usage on ca.wikipedia.org
- Usage on de.wikipedia.org
- Usage on fr.wikipedia.org
- Catastrophe nucléaire de Tchernobyl
- Conséquences sanitaires de la catastrophe de Tchernobyl
- Retombée radioactive
- Protection de l'environnement
- Utilisateur:Kastus
- Wikipédia:Atelier graphique/Cartes/Archives/Demandes mises en sommeil
- Zone d'exclusion nucléaire
- Wikipédia:Oracle/semaine 23 2011
- Wikipédia:Oracle/semaine 19 2012
- Zone d'exclusion de Tchernobyl
- Environnement en Russie
- Environnement en Ukraine
- Environnement en Biélorussie
- Usage on oc.wikipedia.org
- Usage on so.wikipedia.org


