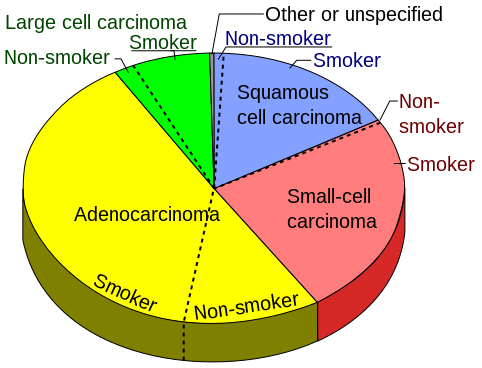
File:Pie chart of lung cancers.svg
Appearance

Size of this PNG preview of this SVG file: 482 × 368 pixels. Other resolutions: 315 × 240 pixels | 629 × 480 pixels | 1,006 × 768 pixels | 1,280 × 977 pixels | 2,560 × 1,955 pixels.
Original file (SVG file, nominally 482 × 368 pixels, file size: 18 KB)
File history
Click on a date/time to view the file as it appeared at that time.
| Date/Time | Thumbnail | Dimensions | User | Comment | |
|---|---|---|---|---|---|
| current | 16:05, 6 March 2019 |  | 482 × 368 (18 KB) | David.haberthuer | Reverted to version as of 16:35, 10 June 2011 (UTC) |
| 15:56, 6 March 2019 |  | 1,143 × 644 (27 KB) | David.haberthuer | Redrawn with matplotlib in Python. The full drawing is done in this Jupyter notebook: https://github.com/habi/wikipedia-plots/blob/master/Cancer%20pie%20chart.ipynb | |
| 16:35, 10 June 2011 |  | 482 × 368 (18 KB) | Mikael Häggström | {{Information |Description ={{en|1=Pie chart of the incidence of lung cancer types, sorted by histological subtypes, in turn sorted into how many are non-smokers versus smokers - defined as current or former smoker of more than 1 ye |
File usage
The following 6 pages use this file:
Global file usage
The following other wikis use this file:
- Usage on ar.wikipedia.org
- Usage on bs.wikipedia.org
- Usage on el.wikipedia.org
- Usage on en.wikiversity.org
- Usage on ha.wikipedia.org
- Usage on he.wikipedia.org
- Usage on hy.wikipedia.org
- Usage on ko.wikipedia.org
- Usage on pl.wikipedia.org
- Usage on pt.wikipedia.org
- Usage on ru.wikipedia.org
- Usage on sh.wikipedia.org
- Usage on sv.wikipedia.org
