
File:Phylogeny of mtDNA haplogroup R0.png

Size of this preview: 800 × 373 pixels. Other resolutions: 320 × 149 pixels | 640 × 298 pixels | 1,024 × 477 pixels | 2,067 × 963 pixels.
Original file (2,067 × 963 pixels, file size: 310 KB, MIME type: image/png)
| This is a file from the Wikimedia Commons. Information from its description page there is shown below. Commons is a freely licensed media file repository. You can help. |
| Description |
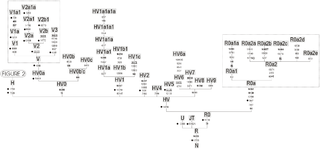
English: Phylogeny of mtDNA haplogroup R0. An expanded view of the haplogroup H phylogeny is shown in other figure below. Underlined positions signal parallel mutations, while @ indicates a back mutation. In bold are the control region variants, whereas dots indicate the SNPs selected and genotyped in the present study. |
| Date | Published: April 2, 2009 |
| Source | Álvarez-Iglesias V, Mosquera-Miguel A, Cerezo M, Quintáns B, Zarrabeitia MT, Cuscó I, et al. (2009) New Population and Phylogenetic Features of the Internal Variation within Mitochondrial DNA Macro-Haplogroup R0. PLoS ONE 4(4): e5112. doi:10.1371/journal.pone.0005112 http://journals.plos.org/plosone/article?id=10.1371/journal.pone.0005112 |
| Author | Vanesa Álvarez-Iglesias , Ana Mosquera-Miguel , Maria Cerezo, Beatriz Quintáns, Maria Teresa Zarrabeitia, Ivon Cuscó, Maria Victoria Lareu, Óscar García, Luis Pérez-Jurado, Ángel Carracedo, Antonio Salas |
| Other versions |
 |
|
This file is licensed under the Creative Commons Attribution 2.5 Generic license.
|
This file was published in a Public Library of Science journal. Their website states that the content of all PLOS journals is published under the Creative Commons Attribution 4.0 license (or its previous version depending on the publication date), unless indicated otherwise.
|
File history
Click on a date/time to view the file as it appeared at that time.
| Date/Time | Thumbnail | Dimensions | User | Comment | |
|---|---|---|---|---|---|
| current | 14:37, 31 July 2016 | | 2,067 × 963 (310 KB) | Was a bee | {{Information |Description={{en|1=Phylogeny of mtDNA haplogroup R0. An expanded view of the haplogroup H phylogeny is shown in other figure below. Underlined positions signal parallel mutations, while @ indicates a back mutation. In bold are the contro... |
File usage
The following page uses this file:
Global file usage
The following other wikis use this file:
- Usage on ar.wikipedia.org