Jump to content

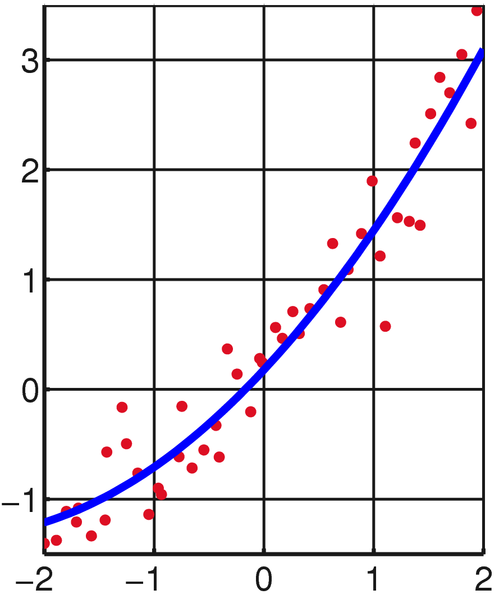
File:Linear least squares2.png

Page contents not supported in other languages.
This is a file from the Wikimedia Commons
From Wikipedia, the free encyclopedia

Original file (889 × 1,067 pixels, file size: 30 KB, MIME type: image/png)

Summary

Description
English: Illustration of linear least squares.
Date (UTC)
Source self-made with MATLAB, tweaked in Inkscape.
Author Oleg Alexandrov
Other versions
 
This diagram was created with MATLAB.
Public domain I, the copyright holder of this work, release this work into the public domain. This applies worldwide.
In some countries this may not be legally possible; if so:
I grant anyone the right to use this work for any purpose, without any conditions, unless such conditions are required by law.

Source code (MATLAB)

% Illustration of linear least squares.
function main()
 
   % KSmrq's colors
   red    = [0.867 0.06 0.14];
   blue   = [0, 129, 205]/256;
   green  = [0, 200,  78]/256;
   yellow = [2764, 194,   0]/256;
   white = 0.99*[1, 1, 1];
   gray = 0.1*white;
 
% Set up the grid and other parameters
   N = 100;
   A = -2.2; B = 7; 
   X = linspace(A, B, N);
   C=-4; D = 4;
 
   % Set up the figure
   lw = 5; % linewidth
   lw2 = lw/2;
   fs = 22; % font size
   figure(1); clf; hold on;
   set(gca, 'fontsize', fs);
   set(gca, 'linewidth', lw2)
   hold on; grid on;
 
   % random numbers
   s=0.16;
   a = 1.7; b = 3; c = 1;
   p = 1; q = 75; r = 1.3;
   M = 50;
   p = s*p; q = s*q; r = s*r;
   XX=linspace(A, B, M+1);
   YY = p+q*XX+r*XX.^2;
   
   Xr = 7*(1:M);
   Yr = Xr;
   for i=1:M
      rd=rand(1);
      Xr(i) = XX(i)*rd+XX(i+1)*(1-rd);
      Yr(i) = p+q*Xr(i)+r*Xr(i)^2 + 0.4*erfinv(2*rand(1) - 1);
   end
 
   myrad = 0.05;
   for i=1:length(Xr)
      ball(Xr(i), Yr(i), myrad, red);
   end

   axis equal;

 
   % least squares fitting
   Yr = Yr';
   Xr=Xr';
   Mat = [(0*Xr+1) Xr Xr.^2];
   V=Mat'*Yr;
   V=(Mat'*Mat)\V;
   pe = V(1); qe = V(2); re=V(3);
   
   plot(X, pe+qe*X+re*X.^2, 'b', 'linewidth', lw);
 
   grid on;
   set(gca, 'GridLineStyle', '-', 'xcolor', gray);
   set(gca, 'GridLineStyle', '-', 'ycolor', gray);
   set(gca, 'XTick', [-2 -1 0 1 2]);
   plot([-2 2], [3.5 3.5], 'linewidth', lw2, 'color', gray);
 
   axis equal;
   axis([-2, 2, -1.7, 3.5]);
 
   saveas(gcf, 'Linear_least_squares2.eps', 'psc2'); % save as eps
   %plot2svg('Linear_least_squares.svg'); % save as svg
 
 
function ball(x, y, r, color)
   Theta=0:0.7:2*pi;
   X=r*cos(Theta)+x;
   Y=r*sin(Theta)+y;
   H=fill(X, Y, color);
   set(H, 'EdgeColor', 'none')

Captions

Add a one-line explanation of what this file represents

Items portrayed in this file

depicts

5 April 2008

File history

Click on a date/time to view the file as it appeared at that time.

Date/TimeThumbnailDimensionsUserComment
current20:10, 21 February 2009Thumbnail for version as of 20:10, 21 February 2009889 × 1,067 (30 KB)Oleg AlexandrovNormal noise, per Michael Hardy
06:32, 5 April 2008Thumbnail for version as of 06:32, 5 April 2008889 × 1,067 (34 KB)Oleg Alexandrovtweak
06:30, 5 April 2008Thumbnail for version as of 06:30, 5 April 2008889 × 1,067 (35 KB)Oleg Alexandrovtweak
06:29, 5 April 2008Thumbnail for version as of 06:29, 5 April 2008889 × 1,067 (34 KB)Oleg Alexandrovtweak
06:28, 5 April 2008Thumbnail for version as of 06:28, 5 April 2008444 × 533 (17 KB)Oleg Alexandrov
06:25, 5 April 2008Thumbnail for version as of 06:25, 5 April 2008444 × 533 (16 KB)Oleg Alexandrovtweak
06:21, 5 April 2008Thumbnail for version as of 06:21, 5 April 2008444 × 533 (16 KB)Oleg Alexandrov{{Information |Description=Illustration of linear least squares. |Source=self-made with MATLAB, tweaked in Inkscape. |Date=~~~~~ |Author= Oleg Alexandrov |Permission=See below |other_versions= }} {{PD

The following page uses this file:

Global file usage

The following other wikis use this file: