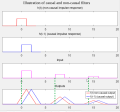
% Options
  frame_background_gray = true;

  if frame_background_gray
   graphics_toolkit("qt")         % has "insert text" option
%  graphics_toolkit("fltk")       % has cursor coordinate readout
   frame_background = .94*[1 1 1];
   d  = 4;                         % amount to add to text sizes
  else
   graphics_toolkit("gnuplot")    % background will be white regardless of value below
   frame_background = .94*[1 1 1];
   d=0;
  endif

  xmax = 1000;                    % length of plots
  L    = 100;                     % length of rectangles

% (https://octave.org/doc/v4.2.1/Graphics-Object-Properties.html#Graphics-Object-Properties)
% Speed things up when using Gnuplot
  set(0, "DefaultFigureColor",frame_background)
  set(0, "DefaultAxesTitleFontweight","normal")
  set(0, "DefaultAxesFontsize",12+d)   % size of numeric tick labels
% set(0, "DefaultTextFontsize",12+d)
  set(0, "DefaultAxesYlim",[0 2])
  set(0, "DefaultAxesXlim",0.02*([-200 xmax]))
  set(0, "DefaultAxesYtick",[])
  set(0, "DefaultLineLinewidth",2)

%=======================================================
  hfig = figure("position",[1 -150 735 835]);

  x1 = .02;                     % left margin
  x2 = .02;                     % right margin
  y1 = .08;                     % bottom margin for annotation
  y2 = .10;                     % top margin for title
  dy = .10;                     % vertical space between rows

  width = 1-x1-x2;
  height= (1-y1-y2-3*dy)/4;     % space allocated for each of 4 rows

  x_origin = x1;
  y_origin = 1;                 % start at top of graph area
%=======================================================
  y_origin = y_origin -y2 -height;        % position of top row
  subplot("position",[x_origin y_origin width height])

  f = [zeros(1,200) ones(1,L) zeros(1,100)];

  plot(0.02*([1:length(f)]-250), f ,"r" )
  title("h(t) (non-causal impulse response)", "fontsize",14+d)

%=======================================================
  y_origin = y_origin -dy -height;
  subplot("position",[x_origin y_origin width height])
  plot(0.02*([1:length(f)]-200), f, "b" )
  title("h(t-1) (causal impulse response)", "fontsize",14+d)

%=======================================================
  y_origin = y_origin -dy -height;
  subplot("position",[x_origin y_origin width height])
  a = [zeros(1,200) ones(1,L) zeros(1,250) 0.5*ones(1,100) zeros(1,250) 0.25*ones(1,100) zeros(1,200)];
  plot(0.02*([1:length(a)]-200), a,"m")
  ylim([0 2*max(a)])
  title("Input", "fontsize",14+d)

%=======================================================
  y_origin = y_origin -dy -height;
  subplot("position",[x_origin y_origin width height])
  b = conv(a,f);
  c = b(200:end);
  plot(0.02*([1:length(c)]-250), c, "r", 0.02*([1:length(c)]-200), c, "b")
  ylim([0 max(b)])
  legend("f(t) non-causal output", "f(t-1) (causal output)")
  title("Outputs", "fontsize",14+d)

 print -dsvg Illustration_of_causal_and_non-causal_filters.svg


