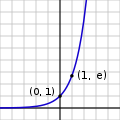
File:Exp.svg
Appearance

Size of this PNG preview of this SVG file: 800 × 600 pixels. Other resolutions: 320 × 240 pixels | 640 × 480 pixels | 1,024 × 768 pixels | 1,280 × 960 pixels | 2,560 × 1,920 pixels.
Original file (SVG file, nominally 800 × 600 pixels, file size: 29 KB)
File history
Click on a date/time to view the file as it appeared at that time.
| Date/Time | Thumbnail | Dimensions | User | Comment | |
|---|---|---|---|---|---|
| current | 04:42, 23 July 2013 |  | 800 × 600 (29 KB) | IkamusumeFan | 1. Thicker line for better display of the thumbnail; 2. Smaller font for better display of the thumbnail. |
| 04:33, 23 July 2013 |  | 800 × 600 (29 KB) | IkamusumeFan | 1. Small font for better display 2. Resize for better display in context | |
| 02:34, 23 July 2013 |  | 400 × 400 (29 KB) | IkamusumeFan | Reverted to version as of 02:13, 23 July 2013 | |
| 02:30, 23 July 2013 |  | 400 × 400 (28 KB) | IkamusumeFan | Remove the tic labels for better display. | |
| 02:13, 23 July 2013 |  | 400 × 400 (29 KB) | IkamusumeFan | 1. Coordinates added; 2. Adjust point size for better display; 3. Generator source code added. | |
| 02:05, 5 July 2007 |  | 400 × 400 (8 KB) | Oleg Alexandrov | positional corrections | |
| 02:04, 5 July 2007 |  | 400 × 400 (8 KB) | Oleg Alexandrov | livelier colors | |
| 02:02, 5 July 2007 |  | 400 × 400 (8 KB) | Oleg Alexandrov | Made lines even thicker | |
| 20:03, 15 March 2007 |  | 400 × 400 (2 KB) | Pjacklam | Smaller dots. (Learning as I go …) | |
| 19:58, 15 March 2007 |  | 400 × 400 (2 KB) | Pjacklam | Corrected the image size. And now the text appears too. Oh, joy! |
File usage
The following page uses this file:
Global file usage
The following other wikis use this file:
- Usage on ba.wikipedia.org
- Usage on be.wikipedia.org
- Usage on bg.wikipedia.org
- Usage on bs.wikipedia.org
- Usage on ca.wikipedia.org
- Usage on ckb.wikipedia.org
- Usage on cs.wikipedia.org
- Usage on cv.wikipedia.org
- Usage on de.wikibooks.org
- Usage on de.wikiversity.org
- Kurs:Vorkurs Mathematik (Osnabrück 2009)/Vorlesung 4
- Kurs:Mathematik (Osnabrück 2009-2011)/Teil I/Vorlesung 25
- Komplexe Exponentialfunktion über Exponentialreihe/Einführung/Textabschnitt
- Kurs:Mathematik für Anwender (Osnabrück 2011-2012)/Teil I/Vorlesung 17
- Reelle Exponentialfunktion über Exponentialreihe/Einführung/Textabschnitt
- Kurs:Analysis (Osnabrück 2013-2015)/Teil I/Vorlesung 2
- Kurs:Analysis (Osnabrück 2013-2015)/Teil I/Vorlesung 15
- Abbildung/Einführende Vorlesung/Ausführlich und umfassend/Textabschnitt
- Abbildung/Darstellungsmöglichkeiten/Gallerie/Textabschnitt
- Kurs:Analysis (Osnabrück 2013-2015)/Teil I/Vorlesung 2/kontrolle
- Kurs:Analysis (Osnabrück 2014-2016)/Teil I/Vorlesung 2
- Kurs:Analysis (Osnabrück 2014-2016)/Teil I/Vorlesung 15
- Kurs:Analysis (Osnabrück 2014-2016)/Teil I/Vorlesung 2/kontrolle
- Kurs:Analysis (Osnabrück 2014-2016)/Teil I/Vorlesung 15/kontrolle
- Kurs:Lineare Algebra (Osnabrück 2015-2016)/Teil I/Vorlesung 2
- Kurs:Lineare Algebra (Osnabrück 2015-2016)/Teil I/Vorlesung 2/kontrolle
- Kurs:Grundkurs Mathematik (Osnabrück 2016-2017)/Teil I/Vorlesung 6
- Kurs:Grundkurs Mathematik (Osnabrück 2016-2017)/Teil I/Vorlesung 6/kontrolle
- Infinitesimalrechnung I
- Kurs:Lineare Algebra (Osnabrück 2017-2018)/Teil I/Vorlesung 2
- Kurs:Lineare Algebra (Osnabrück 2017-2018)/Teil I/Vorlesung 2/kontrolle
- Kurs:Grundkurs Mathematik (Osnabrück 2018-2019)/Teil I/Vorlesung 6
- Kurs:Grundkurs Mathematik (Osnabrück 2018-2019)/Teil I/Vorlesung 6/kontrolle
- Kurs:Mathematik für Anwender (Osnabrück 2019-2020)/Teil I/Vorlesung 3
- Kurs:Mathematik für Anwender (Osnabrück 2019-2020)/Teil I/Vorlesung 12
- Kurs:Mathematik für Anwender (Osnabrück 2019-2020)/Teil I/Vorlesung 3/kontrolle
- Kurs:Mathematik für Anwender (Osnabrück 2019-2020)/Teil I/Vorlesung 12/kontrolle
- Kurs:Mathematik für Anwender (Osnabrück 2019-2020)/Teil I/Repetitorium/Vorlesung 3
- Kurs:Mathematik für Anwender (Osnabrück 2019-2020)/Teil I/Repetitorium/Vorlesung 12
- Kurs:Mathematik für Anwender (Osnabrück 2020-2021)/Teil I/Vorlesung 3
- Kurs:Mathematik für Anwender (Osnabrück 2020-2021)/Teil I/Vorlesung 12
- Kurs:Mathematik für Anwender (Osnabrück 2020-2021)/Teil I/Vorlesung 3/kontrolle
- Kurs:Mathematik für Anwender (Osnabrück 2020-2021)/Teil I/Vorlesung 12/kontrolle
- Kurs:Analysis (Osnabrück 2021-2023)/Teil I/Vorlesung 2
- Kurs:Analysis (Osnabrück 2021-2023)/Teil I/Vorlesung 15
- Kurs:Analysis (Osnabrück 2021-2023)/Teil I/Vorlesung 2/kontrolle
- Kurs:Analysis (Osnabrück 2021-2023)/Teil I/Vorlesung 15/kontrolle
- Kurs:Grundkurs Mathematik (Osnabrück 2022-2023)/Teil I/Vorlesung 6
- Kurs:Grundkurs Mathematik (Osnabrück 2022-2023)/Teil I/Vorlesung 6/kontrolle
View more global usage of this file.


