Jump to content

File:Ethnic demography of the United Kingdom from 1951 - 2021.gif

Page contents not supported in other languages.
This is a file from the Wikimedia Commons
From Wikipedia, the free encyclopedia

Original file (1,920 × 1,755 pixels, file size: 947 KB, MIME type: image/gif, looped, 10 frames, 17 s)

Summary

This file may be updated to reflect new information.
If you wish to use a specific version of the file without it being overwritten, please upload the required version as a separate file.
Description
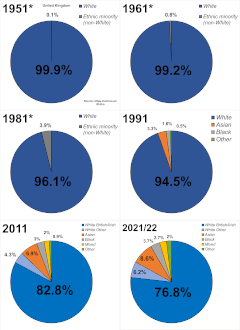
English: Ethnic demography of the United Kingdom from 1951 - 2011 in a pie chart. Data is taken from the United Kingdom census forms on Ethnicity and estimates for the years prior to the question.
Note:
  • From 1951 to 1981, percentages used are estimates for the non-White population.
  • Northern Ireland has not been included within the data for 1951-1991 due to the fact that estimates did not include it for 1951 to 1981 and for 1991 did not take an ethnic census within its own jurisdiction. However this does not distort the figures by much (around 0.2% increase for Whites if population data is substituted in place) due to the fact the jurisdiction had virtually no ethnic minorities.
  • Figures vary from source to source on the exact amount of non-Whites in each decade but do give a general range of the amount. I have attempted to give the best ranges using a variety of sources for each decade. It should be noted however this does not distort the percentage by much. When 'DCoIP' is indicated, I am refering to the main source given for estimations within this file, see Source below.
1939 (not included in file): 7,000 (Source: 1, 2; Page 14 (3) "As recently as 1939, the permanent Black and Asian population was officially estimated at 7,000", 3)
1951: 30,000 (Source: 1), 50,000, 0.1% (Source: DCoIP, 2; p22 "less than 50,000", 3, 4) to 94,500, 0.2% (Source: 1) or 103,000 (Source: 1)
1961: 282,000 (Source: 1) to 400,000 (Source: DCoIP, 2) or 415,000 (Source: 1). Atleast less than 500,000 for higher bound (Source: 1, p22)
1971: 1.2 million (Source: 1, 2, 3) to 1.34 million (Source: DCoIP, 2, 3) or 1.5 million (Source: 1, 2, 3)
1981: 2.09 million, 4% (Source: DCoIP, 2, 3, 4, 5), 2.2 million (Source: 1, 2, 3) or 2.43 million (Source: 1)
Date
Source Own work, data used as described in description; 1951 to 1981: data taken from The Demographic Characteristics of Immigrant Populations by the Council of Europe (Page 506, Table 1) for estimates. 1991: (NOMIS: 1991 census - local base statistics; Table 6 or Casweb), 2001: (1, 2, 3), 2011: (1, 2, 3), 2021/2022: (1, 2, 3, 4)
Author Tweedle

Licensing

I, the copyright holder of this work, hereby publish it under the following license:
w:en:Creative Commons
attribution share alike
This file is licensed under the Creative Commons Attribution-Share Alike 4.0 International license.
You are free:
  • to share – to copy, distribute and transmit the work
  • to remix – to adapt the work
Under the following conditions:
  • attribution – You must give appropriate credit, provide a link to the license, and indicate if changes were made. You may do so in any reasonable manner, but not in any way that suggests the licensor endorses you or your use.
  • share alike – If you remix, transform, or build upon the material, you must distribute your contributions under the same or compatible license as the original.
Any autoconfirmed user can overwrite this file from the same source. Please ensure that overwrites comply with the guideline.

Captions

Add a one-line explanation of what this file represents

Items portrayed in this file

depicts

27 May 2022

image/gif

File history

Click on a date/time to view the file as it appeared at that time.

(newest | oldest) View (newer 10 | ) (10 | 20 | 50 | 100 | 250 | 500)
Date/TimeThumbnailDimensionsUserComment
current18:21, 22 May 2024Thumbnail for version as of 18:21, 22 May 20241,920 × 1,755 (947 KB)Tweedlemistake on original upload of new version, had used wrong starting file. Title and link to file returned
14:11, 22 May 2024Thumbnail for version as of 14:11, 22 May 20241,920 × 1,755 (923 KB)Tweedleupdated to include 2021/2022
11:30, 14 January 2024Thumbnail for version as of 11:30, 14 January 20241,200 × 1,097 (459 KB)TweedleSource link
10:53, 15 June 2023Thumbnail for version as of 10:53, 15 June 20231,200 × 1,097 (223 KB)Tweedletitled chart
21:42, 16 December 2022Thumbnail for version as of 21:42, 16 December 20221,200 × 1,097 (219 KB)Tweedlesize of both labels and the key is bigger
15:21, 16 December 2022Thumbnail for version as of 15:21, 16 December 20221,200 × 1,097 (204 KB)Tweedleextends back to 1951 now based off of estimates for those periods
21:36, 21 September 2022Thumbnail for version as of 21:36, 21 September 20221,200 × 1,097 (201 KB)Tweedlefont
17:13, 3 September 2022Thumbnail for version as of 17:13, 3 September 20221,200 × 1,097 (184 KB)Tweedlestyle
07:40, 17 June 2022Thumbnail for version as of 07:40, 17 June 20221,200 × 1,009 (246 KB)Tweedlere-corrected figures again
18:59, 27 May 2022Thumbnail for version as of 18:59, 27 May 20221,200 × 1,038 (191 KB)Tweedlere-fix with colour coding
(newest | oldest) View (newer 10 | ) (10 | 20 | 50 | 100 | 250 | 500)

Global file usage

The following other wikis use this file:

Metadata