
File:Energy through phase changes.png

Size of this preview: 800 × 517 pixels. Other resolutions: 320 × 207 pixels | 640 × 413 pixels | 960 × 620 pixels.
Original file (960 × 620 pixels, file size: 107 KB, MIME type: image/png)
| This is a file from the Wikimedia Commons. Information from its description page there is shown below. Commons is a freely licensed media file repository. You can help. |
Summary
| Description |
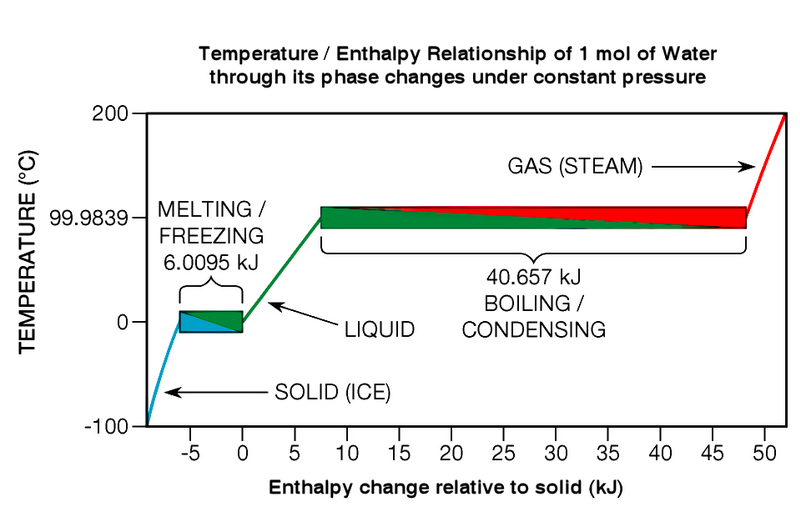
English: Temperature Enthaply relationship of 1 mol of water through its phase changes under constant pressure. This graph shows that the temperature of a water sample does not change during phase transitions as heat flows in or out of it. The total heat capacity of a mole of water in its liquid phase (the green line) is 7.5507 kJ. |
| Date | 20 July 2006T00:16:56Z |
| Source | Own work |
| Author | Greg L |
| Other versions |


|
This diagram image could be re-created using vector graphics as an SVG file. This has several advantages; see Commons:Media for cleanup for more information. If an SVG form of this image is available, please upload it and afterwards replace this template with
{{vector version available|new image name}}.
It is recommended to name the SVG file “Energy through phase changes.svg”—then the template Vector version available (or Vva) does not need the new image name parameter. |
Licensing
Greg L at the English-language Wikipedia, the copyright holder of this work, hereby publishes it under the following license:
| This file is licensed under the Creative Commons Attribution-Share Alike 3.0 Unported license. Subject to disclaimers. | ||
| Attribution: Greg L at the English-language Wikipedia | ||
| ||
| This licensing tag was added to this file as part of the GFDL licensing update. |

|
Permission is granted to copy, distribute and/or modify this document under the terms of the GNU Free Documentation License, Version 1.2 or any later version published by the Free Software Foundation; with no Invariant Sections, no Front-Cover Texts, and no Back-Cover Texts. A copy of the license is included in the section entitled GNU Free Documentation License. Subject to disclaimers. |

|
This media file is uncategorized.
Please help improve this media file by adding it to one or more categories, so it may be associated with related media files (how?), and so that it can be more easily found.
Please notify the uploader with {{subst:Please link images|File:Energy through phase changes.png}} ~~~~ |
File history
Click on a date/time to view the file as it appeared at that time.
| Date/Time | Thumbnail | Dimensions | User | Comment | |
|---|---|---|---|---|---|
| current | 22:04, 7 April 2021 | | 960 × 620 (107 KB) | JohnVanVliet | jpg artifact removal |
| 22:13, 23 September 2010 |  | 960 × 620 (105 KB) | Kbrose | Graphic correction of image (graph labels). | |
| 18:33, 21 July 2008 |  | 960 × 620 (111 KB) | 718 Bot | == Summary == This graph shows how water’s temperature does not change during phase transitions as heat energy flows in or out of it.<br><br>By Greg L 00:16, 20 July 2006 (UTC) == Licensing == {{GFDL-self-with-disclaimers}} {{artifact |
File usage
The following 2 pages use this file:
Global file usage
The following other wikis use this file:
- Usage on bn.wikipedia.org
- Usage on zh.wikipedia.org