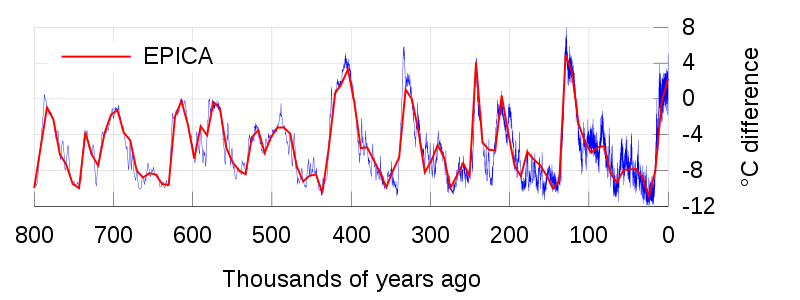
File:EPICA temperature plot.svg
Appearance

Size of this PNG preview of this SVG file: 800 × 300 pixels. Other resolutions: 320 × 120 pixels | 640 × 240 pixels | 1,024 × 384 pixels | 1,280 × 480 pixels | 2,560 × 960 pixels | 2,048 × 768 pixels.
Original file (SVG file, nominally 2,048 × 768 pixels, file size: 96 KB)
File history
Click on a date/time to view the file as it appeared at that time.
| Date/Time | Thumbnail | Dimensions | User | Comment | |
|---|---|---|---|---|---|
| current | 12:30, 25 June 2021 | 2,048 × 768 (96 KB) | Matěj Orlický | cs translation | |
| 21:39, 20 February 2015 | 2,048 × 768 (96 KB) | Delphi234 | add translations | ||
| 01:48, 13 July 2010 | 2,048 × 768 (93 KB) | Autopilot | {{Information |Description={{en|1=This figure shows the {{W|Antarctica|Antarctic}} {{w|temperature}} changes during the last several glacial/interglacial cycles of the present {{w|ice age}} and a comparison to changes in global ice volume. The present da |
File usage
The following 2 pages use this file:
Global file usage
The following other wikis use this file:
- Usage on cs.wikipedia.org
- Usage on fr.wikipedia.org
- Usage on hu.wikipedia.org
- Usage on ko.wikipedia.org
- Usage on zh.wikipedia.org

