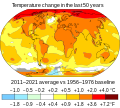
File:Change in Average Temperature With Fahrenheit.svg
Appearance

Size of this PNG preview of this SVG file: 666 × 599 pixels. Other resolutions: 267 × 240 pixels | 533 × 480 pixels | 853 × 768 pixels | 1,138 × 1,024 pixels | 2,276 × 2,048 pixels | 960 × 864 pixels.
Original file (SVG file, nominally 960 × 864 pixels, file size: 236 KB)
File history
Click on a date/time to view the file as it appeared at that time.
| Date/Time | Thumbnail | Dimensions | User | Comment | |
|---|---|---|---|---|---|
| current | 03:34, 13 January 2024 |  | 960 × 864 (236 KB) | Tofeiku | File uploaded using svgtranslate tool (https://svgtranslate.toolforge.org/). Added translation for ms. |
| 21:15, 12 January 2024 |  | 960 × 864 (234 KB) | Efbrazil | Minor wording and graphic tweaks | |
| 20:46, 12 January 2024 |  | 960 × 864 (234 KB) | Efbrazil | Text tweak: in the last 50 years --> over the last 50 years | |
| 19:36, 12 January 2024 |  | 960 × 864 (234 KB) | Efbrazil | Updated to 2023 annual data, change from average to trend line | |
| 11:19, 1 August 2023 |  | 960 × 864 (276 KB) | Jirka Dl | File uploaded using svgtranslate tool (https://svgtranslate.toolforge.org/). Added translation for cs. | |
| 09:23, 1 August 2023 |  | 960 × 864 (273 KB) | Jirka Dl | File uploaded using svgtranslate tool (https://svgtranslate.toolforge.org/). Added translation for cs. | |
| 09:55, 28 August 2022 |  | 960 × 864 (271 KB) | Kleinpecan | Use en dashes and minuses instead of hyphens | |
| 21:17, 13 January 2022 |  | 960 × 864 (271 KB) | Efbrazil | Updated for 2021 data | |
| 23:19, 7 December 2021 |  | 960 × 864 (298 KB) | Efbrazil | Added Fahrenheit, when move happens, will change base file to drop fahrenheit | |
| 01:07, 7 December 2021 |  | 960 × 816 (293 KB) | Efbrazil | Uploaded own work with UploadWizard |
File usage
The following 19 pages use this file:
- Atlantic humpback dolphin
- Climate
- Climate change
- Developing country
- Effects of climate change
- Fire and carbon cycling in boreal forests
- Global surface temperature
- Rain
- Sustainable Development Goal 13
- Talk:Climate change/Archive 94
- User:Bt021/Atlantic humpback dolphin
- User:The Transhumanist
- Wikipedia:Reference desk/Archives/Miscellaneous/2022 August 7
- Wikipedia:Wikipedia Signpost/2022-09-30/News and notes
- Wikipedia:Wikipedia Signpost/Single/2022-09-30
- Portal:Climate change
- Portal:Climate change/Intro
- Portal:Countries
- Portal:Geology
Global file usage
The following other wikis use this file:
- Usage on ast.wikipedia.org
- Usage on azb.wikipedia.org
- Usage on bcl.wikipedia.org
- Usage on be.wikipedia.org
- Usage on bn.wikipedia.org
- Usage on br.wikipedia.org
- Usage on bs.wikipedia.org
- Usage on da.wikipedia.org
- Usage on de.wikipedia.org
- Usage on el.wikipedia.org
- Usage on en.wikiquote.org
- Usage on eo.wikipedia.org
- Usage on eo.wikiquote.org
- Usage on es.wikipedia.org
- Usage on fa.wikipedia.org
- Usage on ga.wikipedia.org
- Usage on gpe.wikipedia.org
- Usage on gv.wikipedia.org
- Usage on ha.wikipedia.org
- Usage on hy.wikipedia.org
- Usage on ia.wikipedia.org
- Usage on ig.wikipedia.org
- Usage on ig.wiktionary.org
- Usage on it.wikipedia.org
- Usage on ko.wikipedia.org
- Usage on kw.wikipedia.org
- Usage on mn.wikipedia.org
- Usage on ms.wikipedia.org
- Usage on pt.wikipedia.org
- Usage on ro.wikipedia.org
- Usage on ru.wikinews.org
View more global usage of this file.
