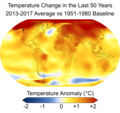
File:Change in Average Temperature.png
Appearance

Size of this preview: 714 × 600 pixels. Other resolutions: 286 × 240 pixels | 572 × 480 pixels | 914 × 768 pixels | 1,219 × 1,024 pixels | 1,500 × 1,260 pixels.
Original file (1,500 × 1,260 pixels, file size: 2.17 MB, MIME type: image/png)
File history
Click on a date/time to view the file as it appeared at that time.
| Date/Time | Thumbnail | Dimensions | User | Comment | |
|---|---|---|---|---|---|
| current | 18:46, 2 October 2019 |  | 1,500 × 1,260 (2.17 MB) | Efbrazil | Moved subtitle to temperature key to clean things up |
| 21:43, 8 February 2019 |  | 1,500 × 1,400 (2.17 MB) | Efbrazil | Slightly improve crop on zoom, title font size drop | |
| 21:35, 8 February 2019 |  | 1,500 × 1,400 (2.13 MB) | Efbrazil | Fixed key, better fonts as per feedback, improved trim on edges of graphic | |
| 20:13, 6 February 2019 |  | 1,500 × 1,400 (2.18 MB) | Efbrazil | Updated for 2018 data, also tic marks added for celcius dividing lines on temperature scale. | |
| 20:49, 2 February 2019 |  | 1,500 × 1,400 (1.95 MB) | Efbrazil | Slightly deemphasized subheading, lower case Anomaly | |
| 21:53, 1 February 2019 |  | 1,500 × 1,411 (2.13 MB) | Efbrazil | Title refocused on the fact that this covers the last 50 years of warming | |
| 21:47, 1 February 2019 |  | 1,500 × 1,400 (1.95 MB) | Efbrazil | Title tweak to emphasize that this data is not a projection or model result | |
| 21:27, 1 February 2019 |  | 1,500 × 1,400 (1.95 MB) | Efbrazil | Dropped font size to better match page font | |
| 23:41, 31 January 2019 |  | 1,560 × 1,414 (2.15 MB) | Efbrazil | User created page with UploadWizard |
File usage
The following 3 pages use this file:
Global file usage
The following other wikis use this file:
- Usage on de.wikipedia.org
- Usage on es.wikipedia.org
- Usage on gl.wikipedia.org
- Usage on gl.wiktionary.org
- Usage on gn.wikipedia.org
- Usage on he.wikipedia.org
- Usage on hyw.wikipedia.org
- Usage on vi.wikipedia.org


