Jump to content

File:Carbon dioxide pressure-temperature phase diagram international.svg

Page contents not supported in other languages.
This is a file from the Wikimedia Commons
From Wikipedia, the free encyclopedia

Original file (SVG file, nominally 711 × 677 pixels, file size: 30 KB)

Summary

Description
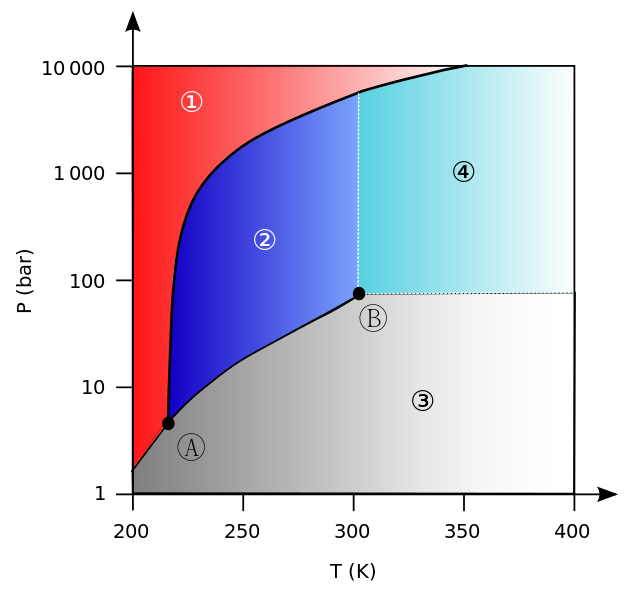
English: Phase diagram of CO2 (carbon dioxide), suitable for international use.

X axis is temperature in kelvin; Y axis is pressure in bar.

Legend:

  • 1: solid phase
  • 2: liquid phase
  • 3: gas phase
  • 4: supercritical fluid phase
  • A: triple point
  • B: critical point
Español: Diagrama de fase de CO2 (dióxido de carbono), válido para uso internacioal.

El eje X representa la temperatura en kelvin; y el eje Y la presión en bares.

Leyenda:

  • 1: fase sólida
  • 2: fase líquida
  • 3: fase gaseosa
  • 4: fase de fluido supercrítico
  • A: punto triple
  • B: punto crítico
Français : Diagramme de phases du CO2 (dioxyde de carbone), convenant à un usage international.

L’axe X represente la température en kelvin; l’axe Y la pression en bars.

Légende :

  • 1: phase solide
  • 2: phase liquide
  • 3: phase gazeuse
  • 4: phase supercritique
  • A: point triple
  • B: punto critique
Date
Source
Author
  • Ben Finney
  • Mark Jacobs
Other versions

[edit]

.svg:

.jpg:

.png:


Image:Carbon dioxide pressure-temperature phase diagram.svg

Licensing

I, the copyright holder of this work, hereby publish it under the following license:
Creative Commons CC-Zero This file is made available under the Creative Commons CC0 1.0 Universal Public Domain Dedication.
The person who associated a work with this deed has dedicated the work to the public domain by waiving all of their rights to the work worldwide under copyright law, including all related and neighboring rights, to the extent allowed by law. You can copy, modify, distribute and perform the work, even for commercial purposes, all without asking permission.

Captions

Phase diagram of carbon dioxide

Items portrayed in this file

depicts

30 November 2010

image/svg+xml

7a8a6e4b7bd632bde87c201d4b5c964aad9ae886

30,412 byte

677 pixel

711 pixel

File history

Click on a date/time to view the file as it appeared at that time.

Date/TimeThumbnailDimensionsUserComment
current03:45, 30 November 2010Thumbnail for version as of 03:45, 30 November 2010711 × 677 (30 KB)Bignose{{Information |Description={{en|1=Phase diagram of CO<sub>2</sub> (carbon dioxide), suitable for international use. X axis is temperature in kelvin; Y axis is pressure in bar. Legend: * ①: solid phase

The following page uses this file:

Global file usage

The following other wikis use this file:

Metadata