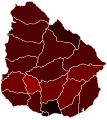
File:COVID-19 Outbreak Cases in Uruguay.svg
Appearance

Size of this PNG preview of this SVG file: 536 × 600 pixels. Other resolutions: 214 × 240 pixels | 429 × 480 pixels | 686 × 768 pixels | 915 × 1,024 pixels | 1,830 × 2,048 pixels | 595 × 666 pixels.
Original file (SVG file, nominally 595 × 666 pixels, file size: 60 KB)
File history
Click on a date/time to view the file as it appeared at that time.
| Date/Time | Thumbnail | Dimensions | User | Comment | |
|---|---|---|---|---|---|
| current | 00:05, 25 March 2021 |  | 595 × 666 (60 KB) | Ffahm | Datos actualizados al 24/03/2021 (Flores sube un nivel) |
| 00:55, 24 March 2021 |  | 595 × 666 (60 KB) | Ffahm | Datos actualizados al 23/03/2021 (Río Negro sube un nivel) | |
| 00:35, 22 March 2021 |  | 595 × 666 (60 KB) | Ffahm | Datos actualizados al 21/03/2021 (Lavalleja sube un nivel) | |
| 23:34, 20 March 2021 |  | 595 × 666 (60 KB) | Ffahm | Datos actualizados al 20/03/2021 (Rocha sube un nivel) | |
| 23:27, 19 March 2021 |  | 595 × 666 (60 KB) | Ffahm | Datos actualizados al 19/03/2021 (Rivera y Treinta y Tres suben un nivel) | |
| 23:42, 17 March 2021 |  | 595 × 666 (60 KB) | Ffahm | Datos actualizados al 17/03/2021 (Paysandú sube un nivel) | |
| 01:24, 16 March 2021 |  | 595 × 666 (60 KB) | Ffahm | Datos actualizados al 15/03/2021 (Río Negro sube un nivel) | |
| 23:03, 12 March 2021 |  | 595 × 666 (60 KB) | Ffahm | Datos actualizados al 12/03/2021 (Soriano sube un nivel) | |
| 01:49, 11 March 2021 |  | 595 × 666 (60 KB) | Ffahm | Datos actualizados al 10/03/2021 (Artigas, Canelones y Colonia suben un nivel) | |
| 22:32, 9 March 2021 |  | 595 × 666 (60 KB) | Ffahm | Datos actualizados al 09/03/2021 (Durazno y Florida suben un nivel) |
File usage
The following 2 pages use this file:
Global file usage
The following other wikis use this file:
- Usage on et.wikipedia.org
- Usage on eu.wikipedia.org
- Usage on fa.wikipedia.org
- Usage on he.wikipedia.org
- Usage on id.wikipedia.org
- Usage on it.wikipedia.org
- Usage on pt.wikipedia.org
- Usage on ru.wikipedia.org
- Usage on simple.wikipedia.org
- Usage on uk.wikipedia.org
- Usage on uz.wikipedia.org
- Usage on vi.wikipedia.org
- Usage on www.wikidata.org
- Usage on zh.wikipedia.org
