Jump to content

File:Bernoulli trial progression.svg

Page contents not supported in other languages.
This is a file from the Wikimedia Commons
From Wikipedia, the free encyclopedia

Original file (SVG file, nominally 512 × 512 pixels, file size: 101 KB)

Summary

Description
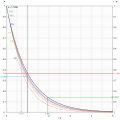
English: Graphs of probability P of not observing independent events each of probability p after n trials vs n p for various p. The graphs are actually discrete points as n are integers but drawn as continuous for clarity. 3 examples are shown:
  • Blue arrow: Throwing a 6-sided die 6 times gives 33.5% chance that 6 never turns up; it can be observed that as n increases, the probability that a 1/n-chance event never appears after n tries rapidly converges to 1/e.
  • Grey arrow: To get 50-50 chance of throwing a Yahtzee (5 cubic dice all showing the same number) requires 0.69 × 1296 ~ 898 throws.
  • Green arrow: Drawing a card from a deck of playing cards without jokers 100 (1.92 × 52) times with replacement gives 85.7% chance of drawing the ace of spades at least once.
Hover over a graph to highlight it.
Source Own work
Author Cmglee

Licensing

I, the copyright holder of this work, hereby publish it under the following licenses:
w:en:Creative Commons
attribution share alike
This file is licensed under the Creative Commons Attribution-Share Alike 3.0 Unported license.
You are free:
  • to share – to copy, distribute and transmit the work
  • to remix – to adapt the work
Under the following conditions:
  • attribution – You must give appropriate credit, provide a link to the license, and indicate if changes were made. You may do so in any reasonable manner, but not in any way that suggests the licensor endorses you or your use.
  • share alike – If you remix, transform, or build upon the material, you must distribute your contributions under the same or compatible license as the original.
GNU head Permission is granted to copy, distribute and/or modify this document under the terms of the GNU Free Documentation License, Version 1.2 or any later version published by the Free Software Foundation; with no Invariant Sections, no Front-Cover Texts, and no Back-Cover Texts. A copy of the license is included in the section entitled GNU Free Documentation License.
You may select the license of your choice.

Captions

Add a one-line explanation of what this file represents

Items portrayed in this file

depicts

image/svg+xml

cb827fead1e3d6151c1e75c2ca90dbbddbb0ed0c

103,460 byte

512 pixel

512 pixel

File history

Click on a date/time to view the file as it appeared at that time.

Date/TimeThumbnailDimensionsUserComment
current11:09, 29 August 2016Thumbnail for version as of 11:09, 29 August 2016512 × 512 (101 KB)CmgleeFix typo on 1 - P axis.
13:25, 20 January 2016Thumbnail for version as of 13:25, 20 January 2016512 × 512 (101 KB)CmgleeAdd CSS to highlight graph hovered over.
21:40, 16 April 2015Thumbnail for version as of 21:40, 16 April 2015512 × 512 (100 KB)Cmglee{{Information |Description ={{en|1=Graphs of probability P of not observing independent events each of probability p after n trials vs n p for various p. The graphs are actually discrete points as n are integers but drawn as continuous for clarity....

The following 2 pages use this file:

Global file usage

The following other wikis use this file:

Metadata