From Wikipedia, the free encyclopedia
No higher resolution available.
Summary
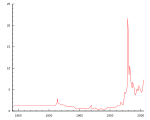
Historic annual average price of an ounce of silver in USD. Data from kitco, new plot made with gnuplot.
1792    1.293
1836    1.293
1837    1.35
1838    1.296
1840    1.296
1841    1.292
1842    1.293
1843    1.292
1856    1.292
1857    1.294
1858    1.292
1861    1.292
1862    1.709
1863    1.952
1864    2.939
1865    1.889
1866    1.766
1867    1.741
1868    1.569
1869    1.569
1870    1.430
1871    1.412
1872    1.449
1873    1.421
1874    1.411
1875    1.394
1876    1.315
1877    1.212
1878    1.1
1879    1.144
1880    1.116
1881    1.129
1882    1.099
1883    1.11
1884    1.084
1885    1.032
1886    1.006
1887    0.970
1888    0.936
1889    0.959
1890    1.056
1891    0.956
1892    0.840
1893    0.703
1894    0.615
1895    0.677
1896    0.664
1897    0.590
1898    0.603
1899    0.6
1900    0.648
1901    0.558
1902    0.487
1903    0.560
1904    0.612
1905    0.655
1906    0.696
1907    0.552
1908    0.494
1909    0.529
1910    0.553
1911    0.556
1912    0.640
1913    0.584
1914    0.503
1915    0.561
1916    0.758
1917    0.899
1918    1.019
1919    1.336
1920    0.655
1921    0.663
1922    0.643
1923    0.650
1924    0.692
1925    0.692
1926    0.538
1927    0.583
1928    0.577
1929    0.488
1930    0.330
1931    0.304
1932    0.254
1933    0.437
1934    0.544
1935    0.584
1936    0.454
1937    0.438
1938    0.428
1939    0.350
1940    0.348
1941    0.351
1942    0.448
1943    0.448
1944    0.448
1945    0.708
1946    0.867
1947    0.746
1948    0.700
1949    0.733
1950    0.8
1951    0.88
1952    0.833
1953    0.853
1954    0.853
1955    0.905
1956    0.914
1957    0.898
1958    0.899
1959    0.914
1960    0.914
1961    1.033
1962    1.199
1963    1.293
1966    1.293
1967    2.06
1968    1.959
1969    1.807
1970    1.635
1971    1.394
1972    1.976
1973    3.137
1974    4.391
1975    4.085
1976    4.347
1977    4.706
1978    5.93
1979    21.693
1980    16.393
1981    8.432
1982    10.586
1983    9.121
1984    6.694
1985    5.888
1986    5.364
1987    6.79
1988    6.108
1989    5.543
1990    4.068
1991    3.909
1992    3.71
1993    4.968
1994    4.769
1995    5.148
1996    4.73
1997    5.945
1998    5.549
1999    5.218
2000    4.951
2001    4.370
2002    4.600
2003    4.876
2004    6.671
2005    7.316
Licensing
Public domain Public domain false false
I, the copyright holder of this work, release this work into the public domain In some countries this may not be legally possible; if so: I grant anyone the right to use this work for any purpose , without any conditions, unless such conditions are required by law.
English Add a one-line explanation of what this file represents
File history
Click on a date/time to view the file as it appeared at that time.
Date/Time Thumbnail Dimensions User Comment current 00:37, 8 April 2006 640 × 480 (3 KB) Renamed user 82lfy1a93y96wr3p Historic annual average price of an ounce of silver in USD. Data from kitco, new plot made in with gnuplot. <pre> 1792 1.293 1836 1.293 1837 1.35 1838 1.296 1840 1.296 1841 1.292 1842 1.293 1843 1.292 1856 1.292 1857 1.294 1
File usage
The following page uses this file:


