Jump to content

File:2DCorrelationSpectrumPresence.svg

Page contents not supported in other languages.
This is a file from the Wikimedia Commons
From Wikipedia, the free encyclopedia

Original file (SVG file, nominally 512 × 512 pixels, file size: 20 KB)

Summary

Description
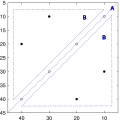
English: Symbolic representation of a two-dimensional (synchronous) correlation spectrum. X- and y-axis are identical to the x-axis of the original dataset. A is the signal on the main diagonal, also referred to as the autocorrelation spectrum. B are the off-axis regions where cross-peaks can be observed.
Nederlands: Symbolische voorstelling van een tweedimensionaal (synchroon) correlatiespectrum. De x- en y-as zijn identiek aan de x-as van de originele dataset. De regio A is het signaal op de hoofddiagonaal, ook het autocorrelatiespectrum genoemd. B zijn de off-as regios die kruispieken kunnen bevatten.
Date
Source Own work
Author Annabel

Licensing

I, the copyright holder of this work, hereby publish it under the following license:
w:en:Creative Commons
attribution share alike
This file is licensed under the Creative Commons Attribution-Share Alike 3.0 Unported license.
You are free:
  • to share – to copy, distribute and transmit the work
  • to remix – to adapt the work
Under the following conditions:
  • attribution – You must give appropriate credit, provide a link to the license, and indicate if changes were made. You may do so in any reasonable manner, but not in any way that suggests the licensor endorses you or your use.
  • share alike – If you remix, transform, or build upon the material, you must distribute your contributions under the same or compatible license as the original.

Captions

Add a one-line explanation of what this file represents

Items portrayed in this file

depicts

3 March 2010

image/svg+xml

3301d8a76c0d8ab11bc686e891e829a7232de6ca

20,507 byte

512 pixel

512 pixel

File history

Click on a date/time to view the file as it appeared at that time.

Date/TimeThumbnailDimensionsUserComment
current21:16, 3 March 2010Thumbnail for version as of 21:16, 3 March 2010512 × 512 (20 KB)AnnabelMinor fix of page size
21:14, 3 March 2010Thumbnail for version as of 21:14, 3 March 2010512 × 516 (20 KB)Annabel{{Information |Description={{en|1=Symbolic representation of a two-dimensional (synchronous) correlation spectrum. X- and y-axis are identical to the x-axis of the original dataset. A is the signal on the main diagonal, also referred to as the autocorrela

The following page uses this file: