Collider (statistics)
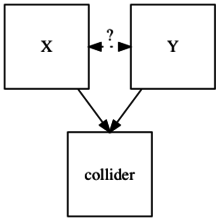
In statistics and causal graphs, a variable is a collider when it is causally influenced by two or more variables. The name "collider" reflects the fact that in graphical models, the arrow heads from variables that lead into the collider appear to "collide" on the node that is the collider.[1] They are sometimes also referred to as inverted forks.[2]

The causal variables influencing the collider are themselves not necessarily associated. If they are not adjacent, the collider is unshielded. Otherwise, the collider is shielded and part of a triangle.[3]
The result of having a collider in the path is that the collider blocks the association between the variables that influence it.[4][5][6] Thus, the collider does not generate an unconditional association between the variables that determine it.
Conditioning on the collider via regression analysis, stratification, experimental design, or sample selection based on values of the collider creates a non-causal association between X and Y (Berkson's paradox). In the terminology of causal graphs, conditioning on the collider opens the path between X and Y. This will introduce bias when estimating the causal association between X and Y, potentially introducing associations where there are none. Colliders can therefore undermine attempts to test causal theories.[citation needed]
Colliders are sometimes confused with confounder variables. Unlike colliders, confounder variables should be controlled for when estimating causal associations.[citation needed]
To detect and manage collider bias, scholars have made use of directed acyclic graphs.[7]
Randomization and quasi-experimental research designs are not useful in overcoming collider bias.[7]
See also
[edit]References
[edit]- ^ Hernan, Miguel A.; Robins, James M. (2010), Causal inference, Chapman & Hall/CRC monographs on statistics & applied probability, CRC, p. 70, ISBN 978-1-4200-7616-5
- ^ Julia M. Rohrer (2018-07-02). "Thinking Clearly About Correlations and Causation: Graphical Causal Models for Observational Data". PsyArXiv. doi:10.31234/osf.io/t3qub. hdl:21.11116/0000-0006-5734-E.
- ^ Ali, R. Ayesha; Richardson, Thomas S.; Spirtes, Peter; Zhange, Jiji (2012). "Towards characterizing Markov equivalence classes for directed acyclic graphs with latent variables". Proceedings of the Twenty-First Conference on Uncertainty in Artificial Intelligence (UAI2006): 10–17. arXiv:1207.1365.
- ^ Greenland, Sander; Pearl, Judea; Robins, James M. (January 1999), "Causal Diagrams for Epidemiologic Research" (PDF), Epidemiology, 10 (1): 37–48, doi:10.1097/00001648-199901000-00008, ISSN 1044-3983, OCLC 484244020, PMID 9888278
- ^ Pearl, Judea (1986). "Fusion, Propagation and Structuring in Belief Networks". Artificial Intelligence. 29 (3): 241–288. CiteSeerX 10.1.1.84.8016. doi:10.1016/0004-3702(86)90072-x.
- ^ Pearl, Judea (1988). Probabilistic reasoning in intelligent systems: networks of plausible inference. Morgan Kaufmann.
- ^ a b Schneider, Eric B. (2020). "Collider bias in economic history research" (PDF). Explorations in Economic History. 78: 101356. doi:10.1016/j.eeh.2020.101356. ISSN 0014-4983. Archived from the original on April 11, 2024.
