Čajniče
Appearance
(Redirected from Cajnice)
Čajniče
Чајниче | |
|---|---|
Town and municipality | |
 Čajniče | |
 Location of Čajniče within Republika Srpska | |
 | |
| Coordinates: 43°33′N 19°04′E / 43.550°N 19.067°E | |
| Country | |
| Entity | |
| Geographical region | Podrinje |
| Government | |
| • Municipal mayor | Miroslav Furtula (SRS 9J) |
| • Municipality | 274.6 km2 (106.0 sq mi) |
| Population (2013 census) | |
| • Town | 2,401 |
| • Municipality | 4,895 |
| • Municipality density | 18/km2 (46/sq mi) |
| Time zone | UTC+1 (CET) |
| • Summer (DST) | UTC+2 (CEST) |
| Area code | 58 |
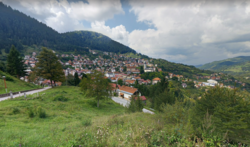
Čajniče (Serbian Cyrillic: Чајниче, pronounced [tʃâːjniːtʃɛ]) is a town and a municipality in Republika Srpska, Bosnia and Herzegovina. As of 2013, the town has a population of 2,401 inhabitants, while the municipality has 4,895 inhabitants.
Settlements
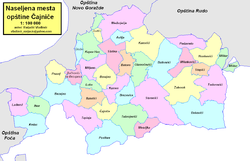
[edit]Aside from the town of Čajniče, the municipality includes the following settlements:
- Avlija
- Batkovići
- Batotići
- Batovo
- Bezujno
- Borajno
- Brezovice
- Bučkovići na Bezujanci
- Đakovići
- Glamočevići
- Gložin
- Hunkovići
- Ifsar
- Kamen
- Kapov Han
- Karovići
- Krstac
- Lađevci
- Luke
- Međurječje
- Metaljka
- Milatkovići
- Miljeno
- Mištar
- Podavrelo
- Ponikve
- Prvanj
- Slatina
- Staronići
- Stopići
- Sudići
- Todorovići
- Trpinje
- Tubrojevići
- Zaborak
Demographics
[edit]

Population
[edit]| Population of settlements – Čajniče municipality | |||||
|---|---|---|---|---|---|
| Settlement | 1971. | 1981. | 1991. | 2013. | |
| Total | 11,602 | 10,280 | 8,956 | 4,895 | |
| 1 | Batotići | 331 | 283 | ||
| 2 | Čajniče | 2,015 | 2,556 | 3,152 | 2,401 |
| 3 | Luke | 351 | 231 | ||
| 4 | Miljeno | 512 | 284 | ||
Ethnic composition
[edit]| Ethnic composition – Čajniče town | |||||||
|---|---|---|---|---|---|---|---|
| 2013. | 1991. | 1981. | 1971. | ||||
| Total | 2,401 (100,0%) | 3,152 (100,0%) | 2,556 (100,0%) | 2,015 (100,0%) | |||
| Serbs | 1,802 (57,17%) | 1,304 (51,02%) | 1,051 (52,16%) | ||||
| Bosniaks | 1,192 (37,82%) | 931 (36,42%) | 857 (42,53%) | ||||
| Others | 105 (3,331%) | 29 (1,135%) | 5 (0,248%) | ||||
| Yugoslavs | 51 (1,618%) | 203 (7,942%) | 8 (0,397%) | ||||
| Croats | 2 (0,063%) | 6 (0,235%) | 19 (0,943%) | ||||
| Montenegrins | 82 (3,208%) | 56 (2,779%) | |||||
| Slovenes | 1 (0,039%) | ||||||
| Albanians | 18 (0,893%) | ||||||
| Macedonians | 1 (0,050%) | ||||||
| Ethnic composition – Čajniče municipality | |||||||
|---|---|---|---|---|---|---|---|
| 2013. | 1991. | 1981. | 1971. | ||||
| Total | 4,895 (100,0%) | 8,956 (100,0%) | 10,280 (100,0%) | 11,602 (100,0%) | |||
| Serbs | 3,972 (81,14%) | 4,709 (52,58%) | 4,892 (47,59%) | 5,353 (46,14%) | |||
| Bosniaks | 884 (18,06%) | 4,024 (44,93%) | 4,880 (47,47%) | 6,065 (52,28%) | |||
| Others | 33 (0,674%) | 141 (1,574%) | 44 (0,428%) | 22 (0,190%) | |||
| Croats | 6 (0,123%) | 5 (0,056%) | 16 (0,156%) | 29 (0,250%) | |||
| Yugoslavs | 77 (0,860%) | 311 (3,025%) | 14 (0,121%) | ||||
| Montenegrins | 118 (1,148%) | 99 (0,853%) | |||||
| Albanians | 18 (0,175%) | 18 (0,155%) | |||||
| Slovenes | 1 (0,010%) | 1 (0,009%) | |||||
| Macedonians | 1 (0,009%) | ||||||
Notable people
[edit]- Hanka Paldum, Bosnian singer
See also
[edit]References
[edit]- Official results from the book Ethnic composition of Bosnia-Herzegovina population, by municipalities and settlements, 1991. census, Zavod za statistiku Bosne i Hercegovine - Bilten no.234, Sarajevo 1991.
External links
[edit]Wikimedia Commons has media related to Čajniče.


