Energy in Italy
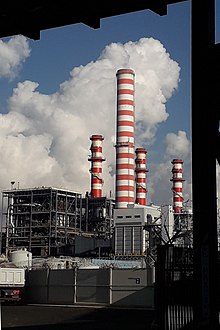
Energy in Italy comes mostly from fossil fuels. Among the most used resources are petroleum (mostly used for the transport sector), natural gas (used for electric energy production and heating), coal and renewables. Italy has few energy resources, and most supplies are imported.[1]
An important share of its electricity is imported, mainly from Switzerland and France. The share of primary energy dedicated to electricity production is above 35%,[2] and has grown steadily since the 1970s.
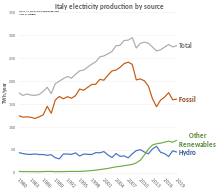
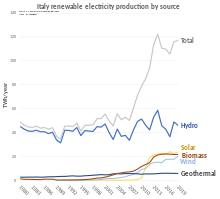
Electricity is produced mainly from natural gas, which accounts for the source of more than half of the total final electric energy produced. Another important source is hydroelectric power, which was practically the only source of electricity until 1960. Wind and solar power grew rapidly between 2010 and 2013 thanks to high incentives. Italy is one of the world's largest producers of renewable energy.[3]
Overview
[edit]
Energy in Italy come mostly from fossil fuels. Among the most used resources are petroleum (mostly used for the transport sector), natural gas (used for electric energy production and heating), coal and renewables. Electricity is produced mainly from natural gas, which accounts for the source of more than half of the total final electric energy produced. Another important source is hydroelectric power, which was practically the only source of electricity until 1960. The first power plant in continental Europe was inaugurated in Milan in 1883.[5]
Eni, with operations in 79 countries, is considered one of the seven "Supermajor" oil companies in the world, and one of the world's largest industrial companies.[6] The Val d'Agri area, Basilicata, hosts the largest onshore hydrocarbon field in Europe.[7] Moderate natural gas reserves, mainly in the Po Valley and offshore Adriatic Sea, have been discovered in recent years and constitute an important mineral resource.[8]
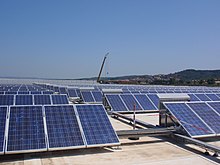
In the last decade, Italy has become one of the world's largest producers of renewable energy, ranking as the second largest producer in the European Union and the ninth in the world. Wind power, hydroelectricity, and geothermal power are also important sources of electricity in the country. Italy was the first country in the world to exploit geothermal energy to produce electricity.[9] The first Italian geothermal power plant was built in Tuscany, which is where all currently active geothermal plants in Italy are located. In 2014 the geothermal production was 5.92 TWh.[10]
Solar energy production alone accounted for almost 9% of the total electric production in the country in 2014, making Italy the country with the highest contribution from solar energy in the world.[3] The Montalto di Castro Photovoltaic Power Station, completed in 2010, is the largest photovoltaic power station in Italy with 85 MW. Other examples of large PV plants in Italy are San Bellino (70.6 MW), Cellino san Marco (42.7 MW) and Sant’ Alberto (34.6 MW).[11]
Renewable sources account for the 27.5% of all electricity produced in Italy, with hydro alone reaching 12.6%, followed by solar at 5.7%, wind at 4.1%, bioenergy at 3.5%, and geothermal at 1.6%.[12] The rest of the national demand is covered by fossil fuels (38.2% natural gas, 13% coal, 8.4% oil) and by imports.[12]
Italy has managed four nuclear reactors until the 1980s, but in 1987, after the Chernobyl disaster, a large majority of Italians passed a referendum opting for phasing out nuclear power in Italy. The government responded by closing existing nuclear power plants and stopping work on projects underway, continuing to work to the nuclear energy program abroad instead. The national power company Enel operates seven nuclear reactors in Spain (through Endesa) and four in Slovakia (through Slovenské elektrárne),[13] and in 2005 made an agreement with Électricité de France for a nuclear reactor in France.[14] With these agreements, Italy has managed to access nuclear power and direct involvement in design, construction, and operation of the plants without placing reactors on Italian territory.[14]
General statistics
[edit]| Population[16] | Primary energy consumption |
Production | Import | Electricity consumption |
CO2-emission[16] | |
| Year | Million | PJ | PJ | PJ | TWh | Mt |
| 1990 | 56.7 | 6,136 | 1,060 | 5,329 | 235 | 389 |
| 2000 | 56.9 | 7,182 | 1,180 | 6,382 | 302 | 420 |
| 2010 | 59.8 | 7,274 | 1,382 | 6,217 | 326 | 392 |
| 2011 | 60.1 | 7,033 | 1,337 | 5,916 | 327 | 384 |
| 2012 | 60.3 | 6,755 | 1,464 | 5,528 | 321 | 367 |
| 2013 | 60.6 | 6,506 | 1,539 | 5,159 | 311 | 338 |
| 2014 | 60.8 | 6,145 | 1,536 | 4,817 | 304 | 319 |
| 2015 | 60.7 | 6,388 | 1,511 | 5,084 | 310 | 330 |
| 2016 | 60.6 | 6,321 | 1,403 | 5,088 | 308 | 326 |
| 2017 | 60.5 | 6,424 | 1,424 | 5,215 | 315 | 322 |
| 2018 | 60.5 | 6,304 | 1,455 | 5,105 | 316 | 317 |
| 2019 | 60.3 | 6,237 | 1,441 | 5,128 | 314 | 309 |
| Variation 1990-2019 |
+6% | +2% | +36% | -4% | +34% | -21% |
International comparisons
[edit]In the rankings published by the International Energy Agency, Italy appears among the top ten countries in the world for several of the indicators:
| Energy source | Indicator | Rank | Year | Quantity | Unity | % world |
| Crude oil[17] | Net import | 8th | 2019 | 65 | Mt | 3.1% |
| Natural gas[18] | Net import | 4th | 2020 | 66 | Mds m³ | 6.8% |
| Electricity[19] | Net import | 2nd | 2019 | 38 | TWh | 11.4% |
| Electricity production by sources[20] | Natural gas | 10th | 2019 | 142 | TWh | 2.2% |
| Wind power | Electrical production[21] | 14th | 2020 | 18.7 | TWh | 1.2% |
| Power installed[22] | 10th | 2019 | 10.7 | GW | 1.7% | |
| Photovoltaic solar energy[23] | Electrical production | 6th | 2019 | 24 | TWh | 3.5% |
| Power installed | 6th | 2019 | 20.9 | GW | 3.5% | |
| % PV/elec. | 1st | 2019 | 8.1 | % | ||
| Biomass[21] | Electrical production | 8th | 2019 | 17.2 | TWh | 3.2% |
| Geothermal[21] | Electrical production | 6th | 2019 | 6.07 | TWh | 6.7% |
Energy resources
[edit]Reserves
[edit]Italy's fossil fuel reserves are modest, but its renewable energy potential is significant, especially for hydro and solar.
- proven and economically recoverable oil reserves are estimated at the end of 2017 at 78 Mt, and additional potential resources at 1,540 Mt; cumulative production up to 2017 reached 205 Mt: Italy has therefore already largely depleted its resources; at the rate of current production (4.1 Mt in 2017), the reserves would be exhausted in 19 years;[24]
- proven and economically recoverable gas reserves are estimated at the end of 2017 at 38 Gm3, and additional potential resources at 405 Gm3; cumulative production up to 2017 reached 766 Gm3: Italy has therefore also largely depleted its resources there; at the rate of current production (5.4 bcm in 2017), proven reserves would be exhausted in 7 years;[24]
- for coal, Italy has only 10 Mt of reserves.[24]
Italy benefits from significant hydroelectric potential, particularly in the Alps, but it is already almost fully exploited; During the first half of the 20th century, hydroelectricity covered almost all of the country's electricity needs.
The map of solar radiation in Italy reveals high potentials in southern Italy, particularly in Sicily and Sardinia.
National energy production
[edit]In 2018, the country's energy production reached 43.42 Mtoe, up 10.9% compared to 2017, broken down into:[25]
- fossil fuels: 21.6%, of which:
- natural gas: 4.46 Mtoe (10.3%), covering 7.5% of domestic gas consumption;
- oil: 4.68 Mtoe (10.8%), 8% of oil consumption;
- coal: 0.25 Mtoe (0.6%), 2.7% of coal consumption;
- renewable energies: 34.02 Mtoe, i.e. 78.4%.
All of these resources covered only 25.2% of the country's needs.[25]

| Source | 1990 | % | 2000 | % | 2010 | % | 2015 | 2020 | % 2020 | var. 2020/1990 |
| Coal | 12 | 1.1 | 0,1 | 0.01 | 2,7 | 0.2 | 2,2 | 0 | 0 % | -100 % |
| Oil | 187 | 17.6 | 196 | 16.7 | 235 | 17.0 | 242 | 241 | 16.4 % | +29 % |
| Natural gas | 587 | 55.4 | 570 | 48.4 | 288 | 20.9 | 232 | 146 | 9.9 % | -75 % |
| Total fossil fuels | 786 | 74.1 | 767 | 65.0 | 526 | 38.1 | 477 | 387 | 26.3 % | -51 % |
| Hydraulic | 114 | 10.7 | 159 | 13.5 | 184 | 13.3 | 164 | 168 | 11.4 % | +48 % |
| Geoth., solar, wind | 125 | 11.8 | 181 | 15.3 | 245 | 17.8 | 373 | 391 | 26.6 % | +214 % |
| Biomass-waste | 36 | 3.4 | 73 | 6.2 | 426 | 30.9 | 498 | 526 | 35.7 % | +1381 % |
| Total renewable energy | 274 | 25.9 | 413 | 35.0 | 856 | 61.9 | 1,035 | 1,086 | 73.7 % | +296 % |
| Total | 1,060 | 100 | 1,180 | 100 | 1,382 | 100 | 1,511 | 1,473 | 100 % | +39 % |
| Source of data: International Energy Agency[15] | ||||||||||
Imported energy
[edit]Italy depends on its imports for a very high share of its energy needs: in 2018, its energy imports reached 158.51 Mtoe against 163.46 Mtoe in 2017; after deducting 31.09 Mtoe of exports (mainly petroleum products), net imports represented 74.0% of the country's total energy consumption, while its national production only covered 25.2% of his needs.[25]
Oil is the main imported energy: in 2018, net imports of oil and oil products reached 51.97 Mt, i.e. 88.7% of the country's domestic oil consumption.[25] The 11 refineries in operation in 2018 have a refining capacity of 83.7 Mt/year, down 2.7% compared to 2017. The Venice biorefinery, the world's first refinery converted to vegetable sources in 2014, has a biodiesel production capacity of 360,000 tonnes /year from used cooking oils and palm oil; this capacity will be increased to 420,000 tonnes/year in 2021, to which will be added the Gela biorefinery (600,000 tonnes/year).[26]
Natural gas is the second most imported energy: in 2018, net imports of natural gas reached 53.27 Mtoe, or 92.9% of the country's gas consumption.[25]
Italy also imported 9.23 Mtoe of coal in 2018, mainly for power plants, coke and heat production plants.[25]
Even electricity is largely imported: 9.66 Mtoe in 2018,[25] or 13% of total gross electricity supply.
Infrastructure
[edit]Refineries
[edit]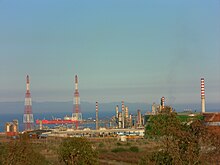
The Priolo Gargallo complex, in Sicily, includes 2 refineries linked by pipelines: ISAB NORD and ISAB SUD, belonging to the Russian company Lukoil, with a total capacity of 16 Mt/year.[27]
The Sarroch refinery in Sardinia (capacity: 15 Mt/year), i.e. more than 20% of the country's refining capacity, belongs to SARAS (Società Anonima Raffinerie Sarde).[28]
In May 2018, the Algerian company Sonatrach bought from Esso (a 100% subsidiary of ExxonMobil) the Augusta refinery in Sicily (capacity: 9.5 Mt/year), three oil terminals located in Augusta, Naples and Palermo and their associated pipeline systems.[29]
The refineries of Porto Marghera, in Veneto, and Gela, in Sicily, have been converted into bio-refineries using as raw materials vegetable oils, waste (frying oil, fats, urban waste), algae, etc. ( 230,000 tonnes/year since 2014 in Porto Marghera, 750,000 tonnes/year since 2019 in Gela).[30]
Gas pipelines
[edit]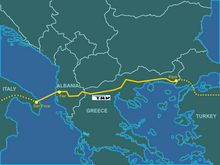
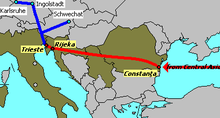
Russian gas is transported to Italy via the Yamal–Europe pipeline, then the Trans Austria Gas Pipeline.
The Trans-Mediterranean Pipeline (or Enrico Mattei gas pipeline) transports gas from Algeria. Starting from Hassi R'Mel, it covers 550 km in Algerian territory, then 370 km in Tunisia, crosses the Mediterranean Sea by an underwater section of 155 km, then Sicily (340 km), the Strait of Messina, before going up the entire Italian peninsula, to join the gas network near Bologna.
The Greenstream pipeline, commissioned in 2004, the longest underwater gas pipeline in the Mediterranean Sea, connects western Libya to Sicily.
The Transitgas Pipeline, inaugurated in 2008, connects the gas market in northwestern Europe with Italy.[31]
The Trans Adriatic Pipeline project is a gas pipeline project transporting natural gas from the Caspian Sea (Azerbaijan) to the European market. It leaves from the Greek-Turkish border and crosses Greece, Albania and the Adriatic Sea to arrive in Italy.[32] Its construction was completed in October 2020 and its operation should begin in mid-November.[33]
Energy consumption
[edit]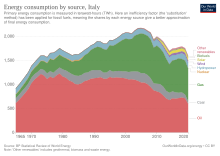
From primary energy consumed to final energy consumed
[edit]| Resources | PJ | % | Use | PJ | % |
| Primary energy production | 1,441 | 23.1 % | Energy branch consumption and losses | 1,248 | 20.0 % |
| Imports | 6,360 | 102.0 % | Final non-energy consumption | 293 | 4.7 % |
| Exports | -1,231 | -19.7 % | Final energy consumption | 4,635 | 74.3 % |
| Holds | -277 | -4.4 % | Statistical discrepancies | 61 | 1.0 % |
| Inventory change | -55 | -0.9 % | |||
| Total resources | 6,237 | 100 % | Total uses | 6,237 | 100 % |
| Energy branch consumption detail | Breakdown of final energy consumption | ||||
| Translation losses | 845 | 68 % | Industry | 1,048 | 22.6 % |
| Own consumption | 322 | 26 % | Transportation | 1,501 | 32.4 % |
| Transmission/distribution losses | 81 | 6 % | Residential | 1,300 | 28.0 % |
| Tertiary | 661 | 14.3 % | |||
| Agriculture + fishing | 123 | 2.7 % | |||
Primary energy consumption
[edit]The total of primary resources produced in Italy or imported in 2018 was 172.3 Mtoe. Primary energy consumption is massively dominated by fossil fuels: 73.9% (coal: 5.4%; oil: 34.5%; natural gas: 34.0%); renewable energies cover only 20.5% of needs, and the electricity import balance provides the remaining 5.6%.[25] Italian primary energy consumption per capita in 2019 was 103.4 GJ, 31% higher than the world average (79.1 GJ).[16]
Electrical renewable energies cover 34.5% of gross domestic electricity consumption;[34] thermal renewable energies provide 10.9 Mtoe, including 7.9 Mtoe from biomass and 2.6 Mtoe from heat pumps; biofuels provide 1.25 Mtoe (biodiesel).[35]
| Source | 1990 | % | 2000 | % | 2010 | % | 2015 | 2020 | % 2020 | var. 2020/1990 |
| Coal | 613 | 10.0 | 526 | 7.3 | 572 | 7.9 | 515 | 199 | 3.4 % | -68 % |
| Oil | 3,488 | 56.8 | 3,636 | 50.6 | 2,734 | 37.6 | 2,242 | 1,842 | 31.9 % | -47 % |
| Natural gas | 1,633 | 26.6 | 2,426 | 33.8 | 2,849 | 39.2 | 2,315 | 2,448 | 42.4 % | +50 % |
| Total fossil fuels | 5,734 | 93.4 | 6,588 | 91.7 | 6,155 | 84.6 | 5,072 | 4,490 | 77.7 % | -22 % |
| Hydraulic | 114 | 1.9 | 159 | 2.2 | 184 | 2.5 | 164 | 168 | 2.9 % | +48 % |
| Geoth., solar, wind | 125 | 2.0 | 181 | 2.5 | 245 | 3.4 | 373 | 391 | 6.8 % | +214 % |
| Biomass-waste | 39 | 0.6 | 94 | 1.3 | 530 | 7.3 | 611 | 612 | 10.6 % | +1,453 % |
| Total renewable energy | 278 | 4.5 | 434 | 6.0 | 959 | 13.2 | 1,148 | 1,171 | 20.3 % | +321 % |
| Electricity tax balance | 125 | 2.0 | 160 | 2.2 | 159 | 2.2 | 167 | 116 | 2.0 % | -7 % |
| Total | 6,136 | 100 | 7,182 | 100 | 7,274 | 100 | 6,388 | 5,777 | 100 % | -6 % |
| Source of data: International Energy Agency[15] | ||||||||||
Final energy consumption
[edit]Breakdown by source
[edit]Final energy consumption (after refining, transformation into electricity or district heating, transport, etc.) was 127.3 Mtoe in 2018, up 1.5% compared to 2017. It was divided into 73, 2% fossil fuels (1.7% coal, 41.8% oil, 29.7% natural gas), 7.0% thermal renewable energies and 19.8% electricity.[36] The production of electricity was split into 60.3% from fossil fuels and 39.7% from renewables; in total, final consumption was therefore 85% fossil fuel and 15% renewable.[37]
Final energy consumption changed as follows:
| Source | 1990 | % | 2000 | % | 2010 | % | 2015 | 2019 | % 2019 | var. 2019/1990 |
| Coal | 149 | 3.1 | 112 | 2.1 | 79 | 1.4 | 40 | 34 | 0.7 % | -78 % |
| Oil products | 2,573 | 53.5 | 2,608 | 48.4 | 2,279 | 40.7 | 1,974 | 1,896 | 38.5 % | -26 % |
| Natural gas | 1,273 | 26.4 | 1,616 | 30.0 | 1,636 | 29.2 | 1,405 | 1,410 | 28.6 % | +11 % |
| Total fossil fuels | 3,995 | 83.0 | 4,336 | 80.4 | 3,994 | 71.3 | 3,419 | 3,340 | 67.8 % | -16 % |
| Solar thermal | 9 | 0.2 | 9 | 0.2 | 11 | 0.2 | 13 | 15 | 0.3 % | +75 % |
| Biomass-waste | 36 | 0.8 | 66 | 1.2 | 378 | 6.7 | 349 | 349 | 7.1 % | +866 % |
| Electricity | 773 | 16.1 | 983 | 18.2 | 1,078 | 19.2 | 1,035 | 1,051 | 21.3 % | +36 % |
| District heating | 0 | 0 | 140 | 2.5 | 161 | 174 | 3.5 % | ns | ||
| Total | 4,813 | 100 | 5,394 | 100 | 5,600 | 100 | 4,976 | 4,929 | 100 % | +2 % |
| Source of data : International Energy Agency[15] | ||||||||||
The share of renewable energies evolved as follows:

| Sector | 2010 | 2015 | 2016 | 2017 | variation % 2017/2010 | |
| Electrical sector | 5.92 | 9.43 | 9.50 | 9.73 | +64 % | |
| Hydraulic (corrected)* | 3.73 | 3.95 | 3.97 | 3.96 | +6 % | |
| Wind (corrected)* | 0.76 | 1.32 | 1.42 | 1.48 | +95 % | |
| Solar | 0.16 | 1.97 | 1.90 | 2.10 | +1,212 % | |
| Geothermal | 0.46 | 0.53 | 0.54 | 0.53 | +15 % | |
| Bioenergy** | 0.81 | 1.67 | 1.67 | 1.66 | +105 % | |
| Thermal sector | 10.02 | 10.69 | 10.54 | 11.21 | +12 % | |
| Geothermal | 0.14 | 0.13 | 0.14 | 0.15 | +7 % | |
| Solar thermal | 0.13 | 0.19 | 0.20 | 0.21 | +62 % | |
| Bioenergy** | 7.65 | 7.78 | 7.59 | 8.20 | +7 % | |
| Heat pumps*** | 2.09 | 2.58 | 2.61 | 2.65 | +27 % | |
| Transport sector | 1.42 | 1.16 | 1.04 | 1.06 | -25 % | |
| Total renewable energies | 17.36 | 21.29 | 21.08 | 22.00 | +27 % | |
| Share of gross final consumption | 13.0 % | 17.5 % | 17.4 % | 18.3 % | ||
| * production corrected for the effects of variations in precipitation (hydro) and wind (wind), according to the rules of Directive 2009/28/EC. **including renewable share of urban waste. *** renewable share | ||||||
Breakdown by sector
[edit]The breakdown of final energy consumption by use was as follows:[36]
- non-energy uses: 5.7 Mtep (4.5%; mainly chemicals);
- bunkers: 3.15 Mtoe (2.5%; aircraft consumption excluding domestic flights and international ferry lines);
- domestic energy use: 118.5 Mtoe (93.1%), of which:
- industry: 27.2 Mtoe (21.4%);
- transport: 40.1 Mtoe (31.5%);
- residential-tertiary: 48.1 Mtoe (37.8%);
- agriculture: 3.0 Mtoe (2.4%).
Note: the International Energy Agency does not take into account international bunkers, which are not domestic consumption.
The breakdown by sector of final energy consumption changed as follows:
| Sector | 1990 | % | 2000 | % | 2010 | % | 2015 | 2019 | % 2019 | var. 2019/1990 |
| Industry | 1,427 | 29.7 | 1,602 | 29.7 | 1,262 | 22.5 | 1,046 | 1,048 | 21.3 % | -27 % |
| Transportation | 1,369 | 28.5 | 1,662 | 30.8 | 1,615 | 28.8 | 1,523 | 1,501 | 30.5 % | +10 % |
| Residential | 1,091 | 22.7 | 1,155 | 21.4 | 1,482 | 26.5 | 1,360 | 1,300 | 26.4 % | +19 % |
| Tertiary | 342 | 7.1 | 483 | 9.0 | 711 | 12.7 | 644 | 661 | 13.4 % | +93 % |
| Agriculture | 122 | 2.5 | 122 | 2.3 | 114 | 2.0 | 112 | 114 | 2.3 % | -6 % |
| Fishing | 8 | 0.2 | 11 | 0.2 | 9 | 0.2 | 8 | 9 | 0.2 % | +5 % |
| Unspecified | 16 | 0.3 | 7 | 0.1 | 7 | 0.1 | 6 | 3 | 0.1 % | -81 % |
| Non-energy uses (chemistry) | 436 | 9.1 | 353 | 6.5 | 400 | 7.1 | 277 | 293 | 5.9 % | -33 % |
| Total | 4,813 | 100 | 5,394 | 100 | 5,600 | 100 | 4,976 | 4,929 | 100 % | +2 % |
| Source of data : International Energy Agency[15] | ||||||||||
Electricity
[edit]In 2014 Italy consumed 291.083 TWh (4,790 kWh/person) in electricity, consumption in household were 1057 kWh/person.[10] Italy is a net importer of electricity: the country imported 46,747.5 GWh and exported 3,031.1 GWh in 2014. Gross production in 2014 was 279.8 TWh. The main power sources are natural gas and hydroelectricity.[10]
Italy has no nuclear power since it was banished in 1987 by referendum. Italy was the first country to exploit geothermal energy to produce electricity.[9] The first Italian geothermal power plant was built in Tuscany, which is where all currently active geothermal plants in Italy are located. In 2014 the geothermal production was 5.92 TWh.[10]
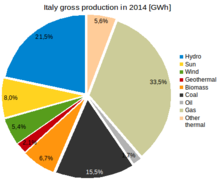
| Hydroelectric | 60.256 | 21.5% |
| Thermal | 176.171 | - |
| of which by Geothermal | 5.919 | 2.1% |
| of which by Natural Gas | 93.637 | 33.5% |
| of which by Coal | 43.455 | 15.5% |
| of which by Oil | 4.764 | 1.7% |
| of which by Biomass | 18.732 | 6.7% |
| Wind | 15.178 | 5.4% |
| Solar | 22.306 | 8.0% |
District heating
[edit]
District heating is widespread in central, eastern and northern Europe,[40] but since the early 1970s it has also begun to spread to Italy.[41] The first Italian city to adopt a district heating network was Brescia in 1972,[42] followed in 1982 by Turin, which since 2011 has the largest city district heating network in Italy and one of the largest in Europe,[43][44] while the Italian region that has the largest extension of the district heating network is Lombardy.[45]
The heat produced by cogeneration plants (94%) as well as by boiler rooms (6%) and distributed by district heating represented 174 PJ in 2019, or 3.5% of the country's final energy consumption, intended for 71% to industry, 21% to the residential sector and 7% to the tertiary sector.[15] It was produced in 2020 from coal for 2.7%, oil for 12.9%, natural gas for 63.1%, biomass for 15.6%, waste for 5.3% and geothermal energy for 0.4%. Production increased by 19% between 2005 and 2020.[21] Italy's heat production reached 231 PJ in 2019, i.e. 1.5% of the world total (10th in the world).[21]
Emissions
[edit]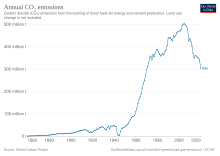
Italy's CO2 emissions reached 5.13 tonnes per capita in 2019, 17% higher than the world average (4.39 t/inhab).[16]
| 1971 | 1990 | 2018 | var. 2018/1971 |
var. 2018/1990 | |
| Emissions[46] (Mt CO2) | 289.4 | 389.4 | 317.1 | +9.6 % | -18.6 % |
| Emissions/capita[46] (t CO2) | 5.35 | 6.87 | 5.25 | -1.9 % | -23.6 % |
| Source : International Energy Agency | |||||
|---|---|---|---|---|---|
The International Energy Agency also provides the emissions for 2019: 302.8 MtCO2, down 4.5% compared to 2018h 1; per capita: 5.02 tCO2.[46]
Energy-related CO2 emissions in Italy experienced strong growth until 2005: 456.4 Mt, i.e. +58% in 34 years, then fell to 428.9 Mt in 2008, collapsed in 2009 due to the Great Recession: -10.5% and continued to decline thereafter.[46]
Per capita, Italy emitted 14.5% less than the European Union average (6.14 t/cap) in 2018.[46]
| Combustible | 1971 Mt CO2 |
1990 Mt CO2 |
2018 Mt CO2 |
% | var. 2018/1990 |
| Coal[46] | 32.6 | 56.6 | 34.3 | 11 % | -39.4 % |
| Oil[46] | 232.7 | 244.8 | 140.2 | 44 % | -42.7 % |
| Natural gas[46] | 24.1 | 87.1 | 137.6 | 43 % | +58 % |
| Source : International Energy Agency | |||||
|---|---|---|---|---|---|
| 2018 emissions | sector share | Emissions/capita | ||
| Sector | Million tons CO2 | % | tons CO2/hab. | |
| Energy sector excluding elect. | 18.1 | 6 % | 0.30 | |
| Industry and building | 71.3 | 22 % | 1.18 | |
| Transport | 103.6 | 33 % | 1.72 | |
| of which road transport | 94.9 | 30 % | 1.57 | |
| Residential | 67.0 | 21 % | 1.11 | |
| Tertiary | 47.7 | 15 % | 0.79 | |
| Total | 317.1 | 100 % | 5.25 | |
| Source : International Energy Agency[46] * after re-allocation of emissions from electricity and heat generation to consumption sectors. | ||||
|---|---|---|---|---|
See also
[edit]- Energy and natural resources of Italy
- Electricity sector in Italy
- Renewable energy in Italy
- Italian Power Exchange
References
[edit]- ^ "IEA Key energy statistics 2010" (PDF). Archived from the original (PDF) on 11 October 2010. Retrieved 5 May 2011.
- ^ data from Terna - Italian electric grid
- ^ a b c "Il rapporto Comuni Rinnovabili 2015". Comuni Rinnovabili (in Italian). Legambiente. 18 May 2015. Retrieved 13 March 2016.
- ^ "The spotlight sharpens: Eni and corruption in Republic of Congo's oil sector". Global Witness.
- ^ "Storia di Milano – La Centrale elettrica di via Santa Radegonda" (in Italian). Retrieved 24 May 2022.
- ^ "Summary for Eni SpA". Retrieved 1 July 2020.
- ^ "In Val d'Agri with Upstream activities". Eni. Archived from the original on 16 May 2022. Retrieved 3 February 2021.
- ^ "Trivellazioni in Adriatico ferme ma il gas italiano costa un decimo" (in Italian). 6 November 2021. Retrieved 12 July 2022.
- ^ a b "Inventario delle risorse geotermiche nazionali". UNMIG. 2011. Archived from the original on 22 July 2011. Retrieved 14 September 2011.
- ^ a b c d e "TERNA statistics data". Archived from the original on 18 May 2012. Retrieved 21 September 2015.
- ^ "The Italian Montalto di Castro and Rovigo PV plants". www.solarserver.com. Retrieved 8 May 2018.
- ^ a b "Rapporto Statistico sugli Impianti a fonti rinnovabili". Gestore dei Servizi Energetici. 19 December 2013. Archived from the original (PDF) on 18 October 2017. Retrieved 11 February 2015.
- ^ "Nuclear Production". Enel. 31 December 2013. Archived from the original on 7 February 2015. Retrieved 11 February 2015.
- ^ a b "Emerging Nuclear Energy Countries". World Nuclear Association. December 2014. Archived from the original on 26 January 2016. Retrieved 11 February 2015.
- ^ a b c d e f g "Data and statistics : Italy - Balances 2020". Retrieved 15 May 2022.
- ^ a b c d "Key World Energy Statistics 2021" (PDF). pp. 60–69. Retrieved 15 May 2022.
- ^ "Key World Energy Statistics 2021" (PDF). p. 13. Retrieved 15 May 2022.
- ^ "Key World Energy Statistics 2021" (PDF). p. 15. Retrieved 15 May 2022.
- ^ "Key World Energy Statistics 2021" (PDF). p. 33. Retrieved 15 May 2022.
- ^ "Key World Energy Statistics 2021" (PDF). p. 31. Retrieved 15 May 2022.
- ^ a b c d e "Data and statistics : Italy - Electricity 2020". Retrieved 15 May 2022.
- ^ "Key World Energy Statistics 2021" (PDF). p. 23. Retrieved 15 May 2022.
- ^ "Key World Energy Statistics 2021" (PDF). p. 25. Retrieved 15 May 2022.
- ^ a b c "BGR Energy Study 2018 - Data and Developments Concerning German and Global Energy Supplies" (PDF). Retrieved 29 November 2019.
- ^ a b c d e f g h "La situazione energetica nazionale nel 2018" (PDF) (in Italian). p. 19. Retrieved 16 May 2022.
- ^ "La situazione energetica nazionale nel 2018" (PDF) (in Italian). pp. 21–22. Retrieved 16 May 2022.
- ^ "Raffinerie de Priolo Gargallo ISAB NORD" (in Italian). Retrieved 16 May 2022.
- ^ "Company profile". Retrieved 16 May 2022.
- ^ "SONATRACH signe un accord avec Esso Italiana (groupe Exxonmobil) pour l'acquisition de la raffinerie d'Augusta et trois terminaux pétroliers" (in French). Retrieved 16 May 2022.
- ^ "From refinery to biorefinery". Retrieved 16 May 2022.
- ^ "Transitgas et Fluxys veulent accroître potentiel du gazoduc suisse" (in French). Retrieved 16 May 2022.
- ^ "Official site of TAP". Retrieved 16 May 2022.
- ^ "The Trans Adriatic Pipeline is Complete". 12 October 2020. Retrieved 16 May 2022.
- ^ "La situazione energetica nazionale nel 2018" (PDF) (in Italian). p. 30. Retrieved 16 May 2022.
- ^ "La situazione energetica nazionale nel 2018" (PDF) (in Italian). p. 31. Retrieved 16 May 2022.
- ^ a b "La situazione energetica nazionale nel 2018" (PDF) (in Italian). p. 42. Retrieved 16 May 2022.
- ^ "La situazione energetica nazionale nel 2018" (PDF) (in Italian). p. 36. Retrieved 16 May 2022.
- ^ "Rapporto Statistico 2017 Fonti rinnovabili" (PDF) (in Italian). p. 15. Retrieved 16 May 2022.
- ^ "Torino: Centrale di Moncalieri" (in Italian). Archived from the original on 2 October 2012. Retrieved 17 May 2022.
- ^ "40 IL TELERISCALDAMENTO: EVOLUZIONE E OPPORTUNITÀ" (PDF) (in Italian). Retrieved 17 May 2022.
- ^ "40 anni di teleriscaldamento a Brescia" (in Italian). 8 February 2013. Retrieved 17 May 2022.
- ^ "Teleriscaldamento: cos'è e progetto Brescia" (in Italian). 19 April 2018. Retrieved 17 May 2022.
- ^ "Centrale accesa. Teleriscaldati altri 150 mila". Archived from the original on 17 October 2011. Retrieved 17 May 2022.
- ^ "Impianti di teleriscaldamento e teleraffrescamento in Italia" (in Italian). Retrieved 17 May 2022.
- ^ "Il teleriscaldamento in Italia. Stato attuale e potenzialità" (PDF) (in Italian). Retrieved 17 May 2022.
- ^ a b c d e f g h i "CO2 Emissions from Fuel Combustion 2020 : Highlights". Archived from the original on 16 April 2021. Retrieved 16 May 2022.

