1998 Taiwanese legislative election
Appearance
(Redirected from 1998 Taiwan legislative election)
| |||||||||||||||||||||||||||||||||||||||||
All 225 seats in the Legislative Yuan 113 seats needed for a majority | |||||||||||||||||||||||||||||||||||||||||
|---|---|---|---|---|---|---|---|---|---|---|---|---|---|---|---|---|---|---|---|---|---|---|---|---|---|---|---|---|---|---|---|---|---|---|---|---|---|---|---|---|---|
| Turnout | 68.09% | ||||||||||||||||||||||||||||||||||||||||
| |||||||||||||||||||||||||||||||||||||||||
 | |||||||||||||||||||||||||||||||||||||||||
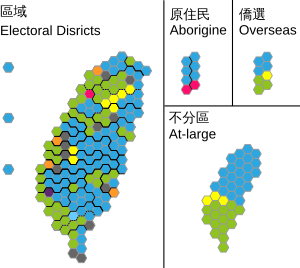
 Elected member party by seat
| |||||||||||||||||||||||||||||||||||||||||
| |||||||||||||||||||||||||||||||||||||||||
Legislative elections were held in Taiwan on 5 December 1998.[1] The result was a victory for the Kuomintang, which won 123 of the 225 seats. Voter turnout was 68%.[2]
Results
[edit]| Party | Votes | % | Seats | +/– | |
|---|---|---|---|---|---|
| Kuomintang | 4,659,679 | 46.43 | 123 | +38 | |
| Democratic Progressive Party | 2,966,834 | 29.56 | 70 | +16 | |
| New Party | 708,465 | 7.06 | 11 | –10 | |
| Democratic Union of Taiwan | 375,118 | 3.74 | 4 | New | |
| New Nation Alliance | 157,826 | 1.57 | 1 | New | |
| Taiwan Independence Party | 145,118 | 1.45 | 1 | New | |
| Democratic Non-Partisan Alliance | 66,033 | 0.66 | 3 | +3 | |
| Green Party Taiwan | 8,089 | 0.08 | 0 | New | |
| Taiwan Indigenous Party | 1,171 | 0.01 | 0 | 0 | |
| Chinese Youth Party | 723 | 0.01 | 0 | New | |
| National Democratic Party | 342 | 0.00 | 0 | New | |
| Independents | 946,431 | 9.43 | 12 | +8 | |
| Total | 10,035,829 | 100.00 | 225 | +61 | |
| Valid votes | 10,035,829 | 98.50 | |||
| Invalid/blank votes | 152,473 | 1.50 | |||
| Total votes | 10,188,302 | 100.00 | |||
| Registered voters/turnout | 14,961,900 | 68.09 | |||
| Source: Nohlen et al. | |||||
References
[edit]- ^ Dieter Nohlen, Florian Grotz & Christof Hartmann (2001) Elections in Asia: A data handbook, Volume II, p535 ISBN 0-19-924959-8
- ^ Nohlen et al., p540


